
• by Paula Johnson, M.A. • IDRA Newsletter • October 2017 •
 October is National Dropout Prevention Month. Two out of 10 students face the life-changing decision of dropping out of school. Students do not arrive at this predicament overnight. Many factors are influential over time in pushing students out the door. However, there are several points along the way where intervention can prevent a young person from relinquishing his or her right to an equitable and quality education. In this article, we discuss the causes, impact and strategies for reducing practices that push out students in the United States.
Over-policed and Under-educated
The IDRA’s 2017 Texas attrition summary reports that almost 100,000 students were lost to attrition during the 2016-17 school year (Johnson, 2017; see story Page 3). Zero tolerance policies in school discipline, unwelcoming or uncaring school environments, and testing that is high-stakes are continuously placing the educational opportunities of millions of children across this country at risk. School push out patterns result from several factors that can ultimately discourage or even prevent youth from staying on course to complete their education. And it is occurring from as young as kindergarten, all the way through high school.
For example, increased policing of students in schools is creating learning environments where minor student infractions, such as tardiness and absences, are bringing students into unwarranted contact with law enforcement through fines and other sanctions (Advancement Project, 2010). These policies have been associated with achievement gaps among all racial groups (Crenshaw, et al., 2015). Practices such as zero-tolerance lead to out-of-school suspensions, expulsions and ticketing, resulting in additional class time missed for punishment or court appearances.
Disparities in student achievement also can produce negative student outcomes, such as lower rates of graduation, employment and income, and increased probability of students dropping out and future involvement with the juvenile and/or criminal justice system (Hinojosa, 2016; Advancement Project, 2010).
IDRA identified six school policies and practices that lead to higher dropout rates, including exclusionary student discipline: zero tolerance; in-grade retention; low funding and insufficient support for English learners; unfair and insufficient funding; watered-down, non-college prep curricula; and testing that is high-stakes. (See infographic.)
Disproportionality in Dropout Rates
There is higher chance of push out for students who have been placed in alternative education settings and the juvenile justice system. Factors such as suspensions, expulsions and systemic inequities have historically resulted in disproportionately higher rates of school pushout for students of color, students from low-income families, and students in the lesbian, gay, bisexual, transgender and queer or questioning (LGBTQ) community. Additionally, there is a large disparity between dropout rates based on student disability status and recency of immigration.
Dropout and graduation rates are not traditionally disaggregated for LGBTQ students and are difficult to find. Still, based on student surveys, the American Psychological Association estimates that LGBTQ students drop out at more than three times the national rate (2012).
Pew Research Center reports that there were an estimated 1.9 million high school dropouts according to the U.S. Census Bureau’s 2016 Current Population Survey (see graph) (Gramlich, 2017). It is important to note that these data reflect all youth ages 14 to 24. The data do not differentiate between students who left school during the school year versus those who have not attended school for two or more years.
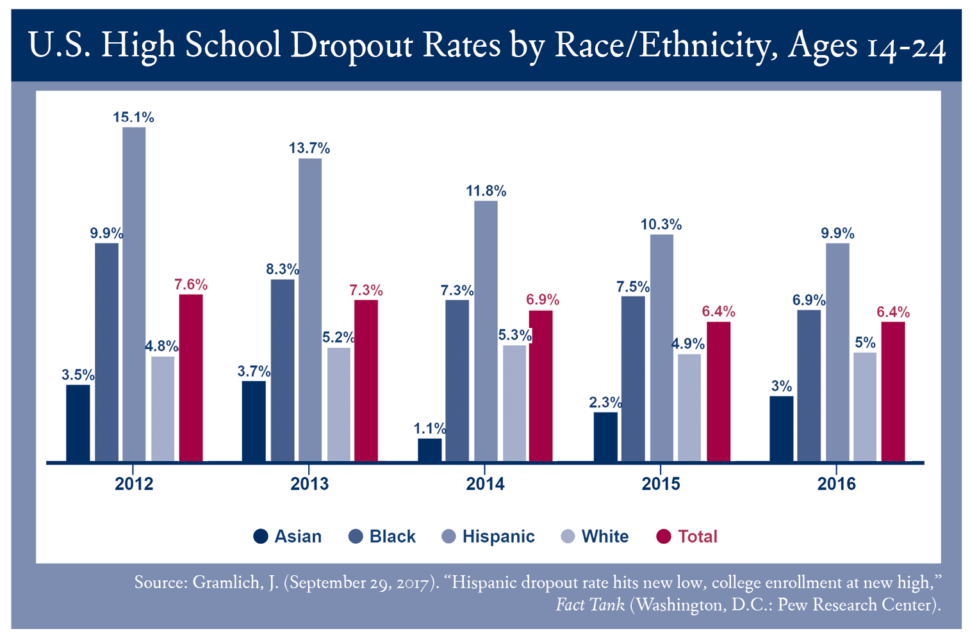
Dropout Rates by Race/Ethnicity and Gender – The U.S. Department of Education (NCES, 2017) reports annually on the status dropout rate, which represents the percentage of 16- to 24-year-olds who are no longer enrolled in school and have not earned a high school diploma or equivalency credential, such as a GED certificate. Though the rates have fallen significantly over the past 60 years, there is a persistent trend of higher rates for minority students.
Based on data from the latest Current Population Survey, from 2010 to 2015, the status dropout rate for youth fell from 7.4 to 5.9 percent. Between 2010 and 2015, the male status dropout rate declined from 8.5 percent to 6.3 percent, and the female status dropout rate declined from 6.3 percent to 5.4 percent. While the rate for male youth was 2.2 percentage points higher than the rate for female youth in 2010, the difference between the rates for males and females in 2015 has fallen to below 1 percent.
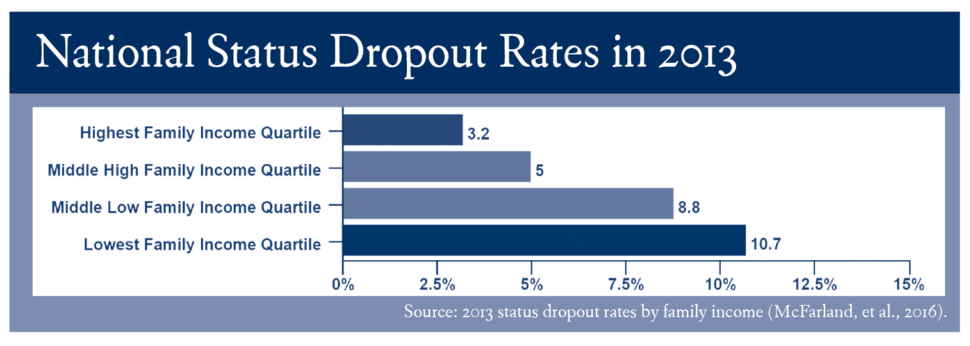
Family Income – The 2016 NCES Compendium Report (McFarland, et al., 2016) summary (see graph) shows that, at 10.7 percent, youth from low-income families had status dropout rates that were nearly three times as high as the rates for their peers from high-income families. The status dropout rate for students from high-income families was 3.2 percent, while the rates for youth from middle- and low-income families were 5.0 and 8.8 percent, respectively. There was no statistically significant difference between the status dropout rate for youth from middle-income families and the rate for youth from low-income families.
Disability – In 2013, the status dropout rate for youth with disabilities (14.9 percent) was more than twice as large as the rate for their peers without disabilities (6.4 percent) (McFarland, et al., 2016).
Recency of Immigration – In 2013, U.S.-born Hispanic youth ages 16 to 24 had lower status dropout rates (8.2 percent for “first generation” and 8.3 percent for “second generation or higher”) than Hispanic youth born outside the United States (McFarland, et al., 2016). Nearly 23 percent of Hispanic youth born outside the United States were reported as high school dropouts. In each group, Hispanic youth had higher status dropout rates than non-Hispanic youth.
Reclaiming Our Students’ Futures
Two change strategies identified in the IDRA Quality Schools Action Framework are school capacity building and coalition building (Bojorquez, 2014). Both strategies support school transformation toward positive student outcomes and welcoming learning environments.
School capacity building can take the form of increased student support services and teacher professional development, or it may require a complete restructuring of campus policies to meet the educational needs of the students. Professional development, such as assistance provided by the IDRA EAC-South, is critical to addresses the socio-emotional needs of students, restorative justice practices, teaching strategies for diverse populations student, and increasing cultural competency.
Coalition building seeks to form strategic alliances to improve equitable educational outcomes for all students. Partnerships with stakeholders at various levels in the community – such as institutions of higher education, local business leaders and organizations, and state and national policymakers – provide opportunities to collaborate, share information and design policies toward improving curriculum, teaching quality and equitable funding for schools.
There is no single solution to the nation’s abysmal graduation rates. But, the first step in addressing this issue is to ensure that every child is provided the opportunity to receive a full and equitable education. Educational policies and practices that leave students feeling criminalized must be eliminated.
IDRA’s School Holding Power Checklist has a set of criteria for assessing and selecting effective dropout prevention strategies and for making sure your school is a quality school. And IDRA’s book, Courage to Connect: A Quality Schools Action Framework (Robledo Montecel & Goodman, 2010) shows how communities and schools can work together to be successful with all of their students. By investing in our youth – all youth – we are investing in a brighter future for us all.
References
Advancement Project. (2010). Test, Punish, and Push Out: How “Zero Tolerance” and High-Stakes Testing Funnel Youth into the School-to-Prison Pipeline (Washington, D.C.: Advancement Project).
American Psychological Association. (2012). Facing the School Dropout Dilemma (Washington, D.C.: American Psychological Association).
Bojorquez, H. (2014). College Bound and Determined (San Antonio, Texas: Intercultural Development Research Association).
Crenshaw K., Ocen P., & Nanda, J. (2015). Black Girls Matter: Pushed Out, Overpoliced and Underprotected (New York: African American Policy Forum and the Center for Intersectionality and Social Policy Studies).
Dignity in Schools Campaign. (2011). Fact Sheet on School Discipline and the Push Out Problem (New York: Dignity in Schools Campaign).
Gramlich, J. (September 29, 2017). “Hispanic dropout rate hits new low, college enrollment at new high,” Fact Tank (Washington, D.C.: Pew Research Center).
Hinojosa, D. (February 2016). “Ensuring Equity and Nondiscrimination in Student Discipline Policy and Practice,” IDRA Newsletter (San Antonio, Texas: Intercultural Development Research Association).
McFarland, J., Stark, P., & Cui, J. (2016). Trends in High School Dropout and Completion Rates in the United States: 2013 (NCES 2016-117). (Washington, D.C.: National Center for Education Statistics).
National Center for Education Statistics. (2017). The Condition of Education 2017 (NCES 2017-144) (Washington, D.C.: National Center for Education Statistics).
Robledo Montecel, M., & Goodman, C. (eds). (2010). Courage to Connect: A Quality Schools Action Framework (San Antonio, Texas: Intercultural Development Research Association).
Other Resources
National Clearinghouse on Supportive School Discipline
Resources on Student Discipline Policy and Practice, by IDRA
Paula Johnson, M.A., is an IDRA education associate. Comments and questions may be directed to her via email at paula.johnson@idra.org.
[©2016, IDRA. This article originally appeared in the October 2017 IDRA Newsletter by the Intercultural Development Research Association. Permission to reproduce this article is granted provided the article is reprinted in its entirety and proper credit is given to IDRA and the author.]

