• by Felix Montes, Ph.D., and Roy L. Johnson, M.S. • IDRA Newsletter • April 2005


This raises two important questions: (1) How are we doing in this area nationwide? and (2) How severe is illiteracy in Texas and its largest cities, including San Antonio, Houston and Dallas? This article provides some answers to those questions.
IDRA has researched the issue of adult illiteracy for many years. Its first study, entitled The Status of Illiteracy in San Antonio (Cárdenas, et al., 1983), was based on 1980 census data. The landmark study found that about one-fourth of the adult population in San Antonio was illiterate.
In 1994, IDRA produced The State of Literacy in San Antonio in the 1990s (Montecel, et al., 1994). Based on 1990 census data, the study found great disparity in the illiteracy rates across economic, geographic, and racial and ethnic groups in San Antonio.
In both studies, IDRA used census data to estimate indexes of illiteracy at the census tract, council district and city levels. The essential idea is that an adult with limited exposure to formal education (up to eighth grade) can be considered functionally illiterate. This definition produces very conservative illiteracy estimates.
For example, IDRA estimated that in the 1990s about 9.4 percent of the U.S. adult population was illiterate. At about the same time, the National Center for Education Statistics reported that between 21 percent and 23 percent of the U.S. adult population was illiterate (1993). NCES had conducted the National Adult Literacy Survey to specifically study literacy. It used a sampling methodology to estimate illiteracy rates in the United States and selected states.
IDRA uses census data because it is immediately accessible and provides information on a longitudinal basis, which allows for long-term studies.
Education attainment is one of the items collected by the U.S. Census Bureau on a consistent basis. The last census occurred in 2000. After concluding the most recent 10-year census, the U.S. Census Bureau started conducting national sampling using its American Community Survey to provide an updated picture of communities around the country every year (U.S. Census Bureau, 2004).
Initially, the Census Bureau selected 36 counties to test this methodology. In addition, other areas were selected for sampling. Using this wealth of information, we are reporting, in this article, conservative illiteracy numbers at the national, state, county and city levels, with an emphasis on Texas and San Antonio.
Reporting is limited to those areas included in the census annual survey, which can be examined on the Census Bureau web site. Following this methodology, the reader can produce a similar analysis for his or her own community.
National Outlook
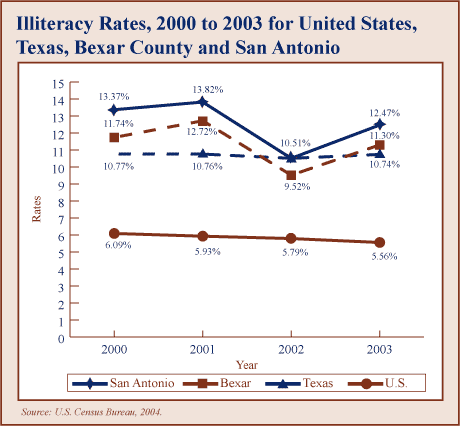
The national rate of illiteracy has been slowly improving in the last four years, from 6.09 percent in 2000 to 5.56 percent in 2003 (see box below). However, there are still more than 10 million people who are illiterate in the country.
National Illiteracy Rates |
|||
|
Year
|
Illiteracy Rate
|
Population
(25 years and over) |
Number of People who were Illiterate
|
| 2000 2001 2002 2003 |
6.09% |
177,532,915 |
10,813,147 |
| Source: U.S. Census Bureau. 2004 ACS Congressional Toolkit (Washington, D.C.: U.S. Census Bureau, 2004). | |||
Notably, the census sampling procedure did not include people in special situations and conditions, such as detention, homelessness and undocumented status, where there is often a higher concentration of people with low educational attainment.
These 10 million people are likely lost in this information-rich society, not being able to make sense of all the literary and numerical information around us. The high illiteracy rates have a considerable cost to the country and to all of us. For example, in 1994, IDRA reported that the national cost of illiteracy ranged from $25 billion to $30 billion per year in lost productivity, errors and accidents (Montecel, et al., 1994).
State of Texas Outlook
Illiteracy rates vary considerably from one state to another, from less than 3 percent in Wyoming and Utah to more than 10 percent in Texas and California over the four-year period of 2000 to 2003 (see box below).
United States Illiteracy Rates by State,
|
|||||||||||
|
2000
|
2001
|
2002
|
2003
|
||||||||
| Rate | State |
Population
|
Rate
|
State |
Population
|
Rate
|
State |
Population
|
Rate | State | Population |
|
11.62% |
Kentucky California Texas West Virginia Mississippi Louisiana Tennessee New Mexico Alabama North Carolina Arkansas Georgia Arizona Rhode Island South Carolina North Dakota New York Illinois Virginia Hawaii Indiana Florida District of Columbia South Dakota Missouri Oklahoma New Jersey Massachusetts Connecticut Vermont Maryland Pennsylvania Idaho Wisconsin Nevada Oregon Maine Delaware Iowa Minnesota Kansas Montana Ohio Michigan Nebraska Colorado Washington Alaska New Hampshire Utah Wyoming U.S. |
2,585,238
20,740,042 12,419,245 1,217,154 1,709,302 2,692,334 3,660,149 1,111,241 2,812,635 5,150,795 1,680,179 5,048,186 3,180,898 679,827 2,525,939 397,643 12,184,401 7,775,033 4,555,970 784,502 3,795,586 10,733,834 370,634 460,514 3,535,366 2,137,971 5,532,569 4,158,807 2,232,500 398,866 3,403,822 8,017,844 771,021 3,398,503 1,285,350 2,185,522 851,088 499,884 1,839,150 3,086,128 1,660,887 572,946 7,236,603 6,263,911 1,060,246 2,720,777 3,749,855 368,259 809,019 1,178,255 306,485 177,532,915 |
10.76%
10.49% 10.24% 10.14% 8.63% 8.62% 8.50% 8.29% 8.26% 7.79% 7.77% 7.50% 7.02% 6.92% 6.80% 6.75% 6.68% 6.48% 6.42% 6.42% 6.29% 6.02% 6.01% 5.96% 5.56% 5.50% 5.40% 5.30% 5.04% 4.96% 4.96% 4.96% 4.88% 4.77% 4.75% 4.68% 4.59% 4.44% 4.38% 4.37% 4.24% 4.05% 3.99% 3.88% 3.81% 3.80% 3.53% 3.51% 3.44% 2.68% 2.44% 5.93% |
Texas Kentucky California West Virginia Tennessee New Mexico Mississippi Louisiana Arkansas Arizona Alabama North Carolina Illinois Georgia North Dakota Rhode Island District of Columbia Virginia Hawaii New York South Carolina Nevada South Dakota Florida New Jersey Indiana Oklahoma Missouri Idaho Connecticut Maine Pennsylvania Maryland Vermont Massachusetts Delaware Wisconsin Colorado Oregon Minnesota Iowa Nebraska Kansas New Hampshire Michigan Ohio Alaska Montana Washington Utah Wyoming U.S. |
12,613,324
2,596,609 20,864,293 1,205,993 3,689,753 1,121,099 1,708,691 2,667,853 1,689,790 3,242,125 2,823,284 5,181,994 7,925,280 5,128,506 405,540 686,163 374,825 4,581,483 784,290 12,276,420 2,560,282 1,337,622 472,463 10,902,961 5,720,017 3,885,447 2,147,675 3,567,825 782,522 2,271,517 879,420 8,085,006 3,431,740 410,309 4,255,673 508,010 3,471,493 2,777,995 2,233,068 3,194,925 1,846,641 1,065,127 1,699,800 837,202 6,407,508 7,366,371 370,363 575,804 3,809,133 1,207,115 310,871 179,959,220 |
10.71%
10.51% 10.51% 8.89% 8.89% 8.28% 8.21% 7.98% 7.56% 7.50% 7.29% 7.26% 7.17% 7.07% 7.05% 6.73% 6.59% 6.55% 6.42% 6.31% 6.11% 5.92% 5.91% 5.85% 5.60% 5.44% 5.30% 4.98% 4.88% 4.77% 4.75% 4.69% 4.65% 4.62% 4.62% 4.61% 4.51% 4.44% 4.36% 4.13% 4.08% 3.98% 3.92% 3.79% 3.68% 3.55% 3.29% 2.99% 2.98% 2.85% 2.65 % 5.79% |
California Texas Kentucky Mississippi New Mexico West Virginia Louisiana Tennessee Nevada Alabama North Carolina Arkansas Arizona Rhode Island New York South Carolina North Dakota Georgia Illinois Hawaii Virginia South Dakota Florida District of Columbia Indiana New Jersey Connecticut Oklahoma Colorado Massachusetts Missouri Maine Pennsylvania Idaho Iowa Wisconsin Minnesota Maryland Delaware Oregon Kansas Vermont Nebraska Ohio Washington Michigan Montana New Hampshire Wyoming Alaska Utah U.S. |
21,594,245
13,032,477 2,672,274 1,741,109 1,152,867 1,217,142 2,711,795 3,753,053 1,388,930 2,853,602 5,308,455 1,711,494 3,365,815 699,637 12,396,264 2,627,714 401,044 5,284,450 7,949,828 811,147 4,676,826 468,434 11,184,263 378,881 3,853,005 5,647,970 2,237,437 2,182,574 2,856,011 4,262,361 3,607,694 883,159 8,069,694 810,634 1,865,410 3,478,463 3,183,619 3,503,106 520,500 2,293,132 1,682,692 407,818 1,077,199 7,261,319 3,881,066 6,346,040 587,518 838,178 315,510 382,225 1,270,186 182,686,266 |
10.74%
10.21% 9.47% 9.28% 8.90% 8.06% 7.99% 7.84% 7.22% 7.19% 7.19% 7.06% 7.02% 7.02% 6.97% 6.65% 6.22% 6.15% 6.12% 6.05% 6.03% 5.95% 5.60% 5.57% 5.50% 5.47% 5.09% 4.88% 4.71% 4.55% 4.46% 4.38% 4.36% 4.12% 4.04% 4.04% 4.03% 3.90% 3.86% 3.82% 3.76% 3.68% 3.66% 3.60% 3.46% 3.44% 3.20% 2.98% 2.91% 2.75% 2.50% 5.56% |
Texas California Kentucky New Mexico West Virginia Mississippi Arkansas Louisiana Tennessee North Carolina Rhode Island Nevada Arizona New York Alabama Georgia Illinois District of Columbia South Carolina Virginia North Dakota New Jersey South Dakota Florida Indiana Hawaii Oklahoma Massachusetts Colorado Missouri Idaho Vermont Connecticut Wisconsin Delaware Maryland Kansas Iowa Pennsylvania Oregon Michigan Maine Nebraska Minnesota Ohio Washington New Hampshire Montana Alaska Utah Wyoming U.S. ? |
13,188,692
21,985,965 2,646,695 1,155,887 1,217,163 1,747,328 1,718,936 2,739,001 3,789,235 5,356,059 701,015 1,437,140 3,435,332 12,503,233 2,866,706 5,361,208 7,992,566 377,677 2,634,137 4,731,871 401,120 5,658,565 469,606 11,327,312 3,860,175 816,603 2,185,412 4,252,186 2,887,866 3,613,723 823,835 410,797 2,286,106 3,489,447 525,447 3,549,482 1,687,045 1,876,363 8,110,218 2,319,217 6,396,371 882,561 1,086,209 3,214,281 7,324,021 3,945,050 846,531 590,841 379,077 1,276,300 317,515 184,395,128?? |
| Source: U.S. Census Bureau. 2004 ACS Congressional Toolkit (Washington, D.C.: U.S. Census Bureau, 2004). | |||||||||||
In 2003, Texas was the most illiterate state in the country with a 10.74 percent illiteracy rate. This translates to more than 1.3 million people in the state who are illiterate. Texas has been among the top three states achieving that dubious distinction in each of the four years included in this analysis.
In two instances, Texas was at the very top of the list of the most illiterate states. The other two states were California and Kentucky, which also topped the list at least once.
Texas Counties
In Texas, five counties were included in the census multi-year analytical profiles. Their illiteracy rates are included in the box below. Their rates range from 6.60 percent to 12.48 percent in the period covered. Bexar County, where San Antonio is located, has been near the top with rates ranging from 9.52 to 12.72 percent. In 2003, its estimated rate was 11.30 percent, which suggests that nearly 100,000 people were illiterate that year.
Harris and Dallas counties have also been at the top of the list with 11.50 and 10.70 percent in 2003, respectively. That translates to nearly 250,000 and 150,000 people in these counties who were illiterate, respectively.
Texas Illiteracy Rates by Major Counties,
|
|||||||||||
|
2000
|
2001
|
2002
|
2003
|
||||||||
| Rate | State |
Population
|
Rate
|
State |
Population
|
Rate
|
State |
Population
|
Rate | State | Population |
|
12.48% 11.74% 10.98% |
Harris Bexar Dallas Tarrant Fort Bend |
2,033,758
832,545 1,337,771 1,217,154 209,141 |
12.72%
11.85% 9.60% 7.49% 7.04% |
Bexar Harris Dallas Tarrant Fort Bend |
838,768
2,063,245 1,350,016 896,496 222,025 |
12.08%
11.87% 9.52% 7.38% 7.18% |
Dallas Harris Bexar Tarrant Fort Bend |
1,393,638
2,152,153 865,163 932,524 238,998 |
11.50%
11.30% 10.70% 6.94% 6.93% |
Harris Bexar Dallas Tarrant Fort Bend |
2,160,316
877,677 1,380,282 944,942 247,753? |
| Source: U.S. Census Bureau. 2004 ACS Congressional Toolkit (Washington, D.C.: U.S. Census Bureau, 2004). | |||||||||||
Texas Cities
As geographic units, three Texas cities were included in the longitudinal sampling, given their large populations. Their illiteracy rates also are included in box below. Their rates range from 10.51 percent to 15.81 percent in the period covered. With a 12.47 percent rate in 2003, San Antonio had more than 90,000 people who were illiterate. Houston (14.13 percent) and Dallas (13.88 percent) had more than 168,000 and 102,000 people who were illiterate in 2003, respectively.
Texas Illiteracy Rates by Major Texas Cities,
|
|||||||||||
|
2000
|
2001
|
2002
|
2003
|
||||||||
| Rate | State |
Population
|
Rate
|
State |
Population
|
Rate
|
State |
Population
|
Rate | State | Population |
|
15.81% |
Houston San Antonio Dallas |
1,177,798
686,775 706,753 |
14.62%
13.82% 12.60% |
Houston San Antonio Dallas |
1,183,939
694,510 721,613 |
14.83%
13.53% 10.51% |
Dallas Houston San Antonio |
720,237
1,214,854 712,516 |
14.13%
13.88% 12.47% |
Houston Dallas San Antonio |
1,195,010
738,147 728,353 |
| Source: U.S. Census Bureau. 2004 ACS Congressional Toolkit (Washington, D.C.: U.S. Census Bureau, 2004). | |||||||||||
San Antonio Illiteracy Rates |
|||
|
Year
|
Illiteracy Rate
|
Population (25 year and over)
|
Number of People who were Illiterate
|
| 2000 |
13.37%
|
686,775
|
91,822
|
| 2001 |
13.82%
|
694,510
|
95,981
|
| 2002 |
10.51%
|
712,516
|
74,885
|
| 2003 |
12.47%
|
728,353
|
90,826
|
| Source: U.S. Census Bureau. 2004 ACS Congressional Toolkit (Washington, D.C.: U.S. Census Bureau, 2004). | |||
San Antonio’s illiteracy rate has fluctuated between 10.51 percent and 13.82 percent in the period 2000 to 2003. The year 2001 was a particularly good one, when the rate dropped about 2 percentage points from the previous year. However, the number of individuals who were illiterate in that population generally has exceeded 90,000 during the period (see box on right).
Summary
Although the trend is for the illiteracy rate to slowly decline, the numbers are still quite high, representing millions of people at the national level and tens of thousands or hundreds of thousands at the local level.
Texas has an illiterate rate twice as large as the country’s average, and Bexar County’s illiteracy rate is generally higher than the state average. San Antonio has an illiteracy rate consistently higher than Bexar County throughout this four-year period. Houston and Dallas demonstrate the same tendency toward higher local illiteracy rates.
A Future of Universal Literacy is More Remote
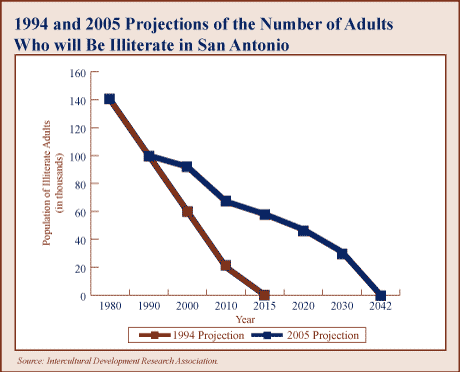
In 1994, IDRA projected that it would take San Antonio another three decades to solve the literacy problem, and concluded that progress, at that rate, would be too slow (Montecel, et al., 1994). These estimates were made by extrapolating the 10 percentual point decrease in the illiteracy rate from 1980 to 1990. Three decades – a whole generation – is far too long.
With the benefit of the new data presented here, we applied the same simple lineal projection technique and found that today – 10 years later – San Antonio is even further away from its universal literacy goal (see box below). The updated projection shows that San Antonio now needs 37 additional years to solve its illiteracy problem, assuming that efforts would be sustained at current levels. Again, these are conservative estimates.
This is no time to cut funding or weaken efforts to ameliorate illiteracy at the local, state or national level.


Conclusions
At least three conclusions can be drawn from this analysis. First, the proposed virtual elimination of funds for literacy development is misguided. We continue to have a significant illiteracy problem that requires creative solutions. In some areas, such as in Texas, the problem is even worse than projected.
Second, efforts to curb the problem must start at the local level, particularly in the cities included in this analysis in which the rates are much higher.
Third, since funds soon may be unavailable from the federal government, communities across the country must work together by creating coalitions to find the most appropriate solutions in their particular situations, probably using their own resources.


Resources
Cárdenas, J., and S. Jackson, D. Ramírez. The Status of Illiteracy in San Antonio (San Antonio, Texas: Intercultural Development Research Association, 1983).
Montecel, M., and J. Supik, F. Montes, N. Adame-Reyna. The State of Literacy in San Antonio in the 1990s (San Antonio, Texas: Intercultural Development Research Association, 1994).
Montes, F. “Community Involvement Needed to Achieve Universal Literacy,” IDRA Newsletter (San Antonio, Texas: Intercultural Development Research Association, September, 1994).
National Center for Education Statistics. Adult Literacy in America: A First Look at the Results of the National Literacy Survey (Washington D.C.: Office of Educational Research and Improvement, U.S. Department of Education, 1993).
U.S. Census Bureau. 2004 ACS Congressional Toolkit (Washington D.C.: U.S. Census Bureau, 2004).
Felix Montes, Ph.D., is an education associate, in the IDRA Division of Professional Development. Roy L. Johnson, M.S., is the director of the IDRA Division of Evaluation Research. Comments and questions may be directed to them via e-mail at feedback@idra.org.
[©2005, IDRA. This article originally appeared in the April 2005 IDRA Newsletter by the Intercultural Development Research Association. Permission to reproduce this article is granted provided the article is reprinted in its entirety and proper credit is given to IDRA and the author.]


