Infographics
Top 10 Percent Plan Expands College Access Across Texas – Infographic
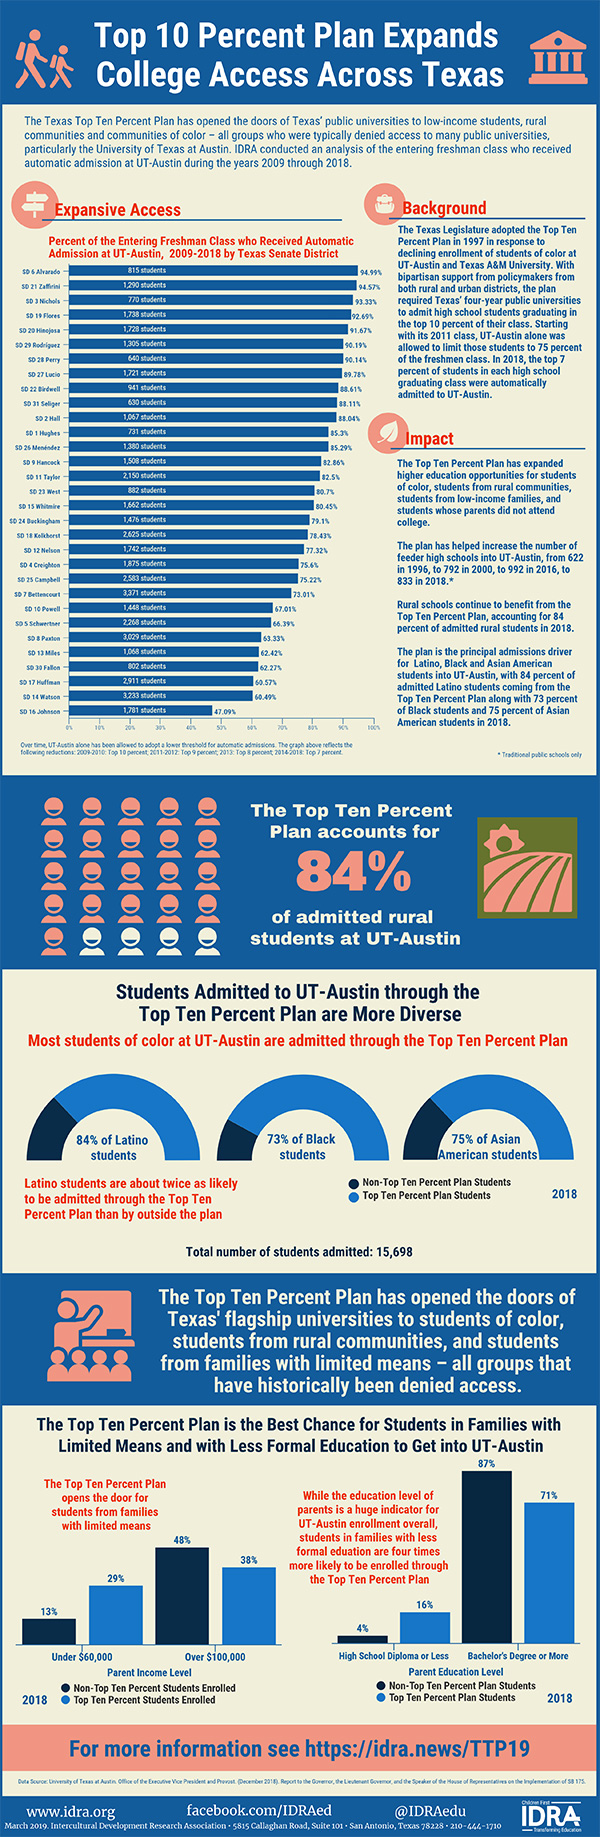
The Texas Top Ten Percent Plan has opened the doors of Texas’ public universities to low-income students, rural communities and … read more
How to Testify before the Georgia General Assembly
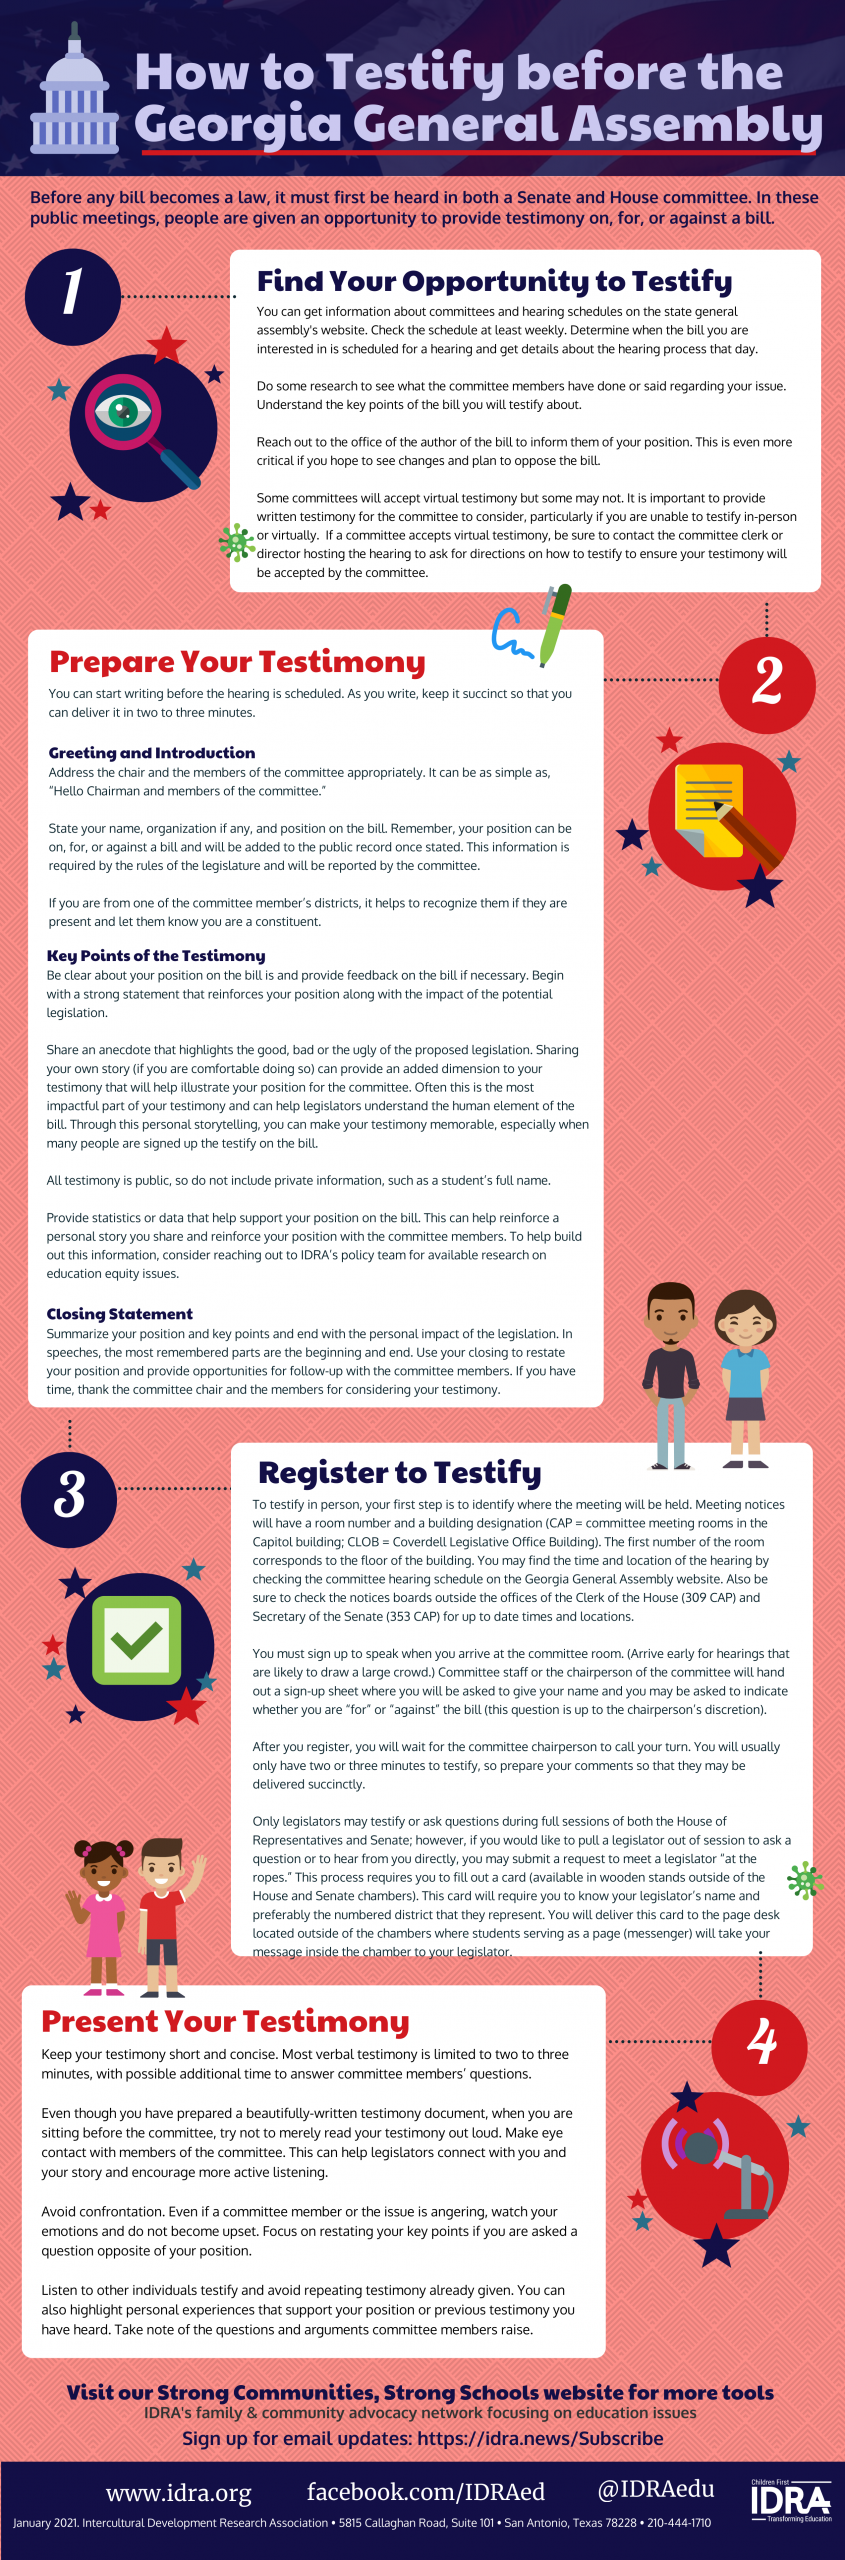
Before any bill becomes a law, it must first be heard in both a Senate and House committee. In these … read more

How to Meet with Your Elected Official – Infographic
Meeting with your elected officials gives you the opportunity to share information, data and policy ideas about the issues that … read more

How to Testify before the Texas Legislature – Infographic
Before any bill becomes a law, it must first be heard in both a Senate and House committee. In these … read more
Texas Bilingual Education Bills in 2021 – Infographic
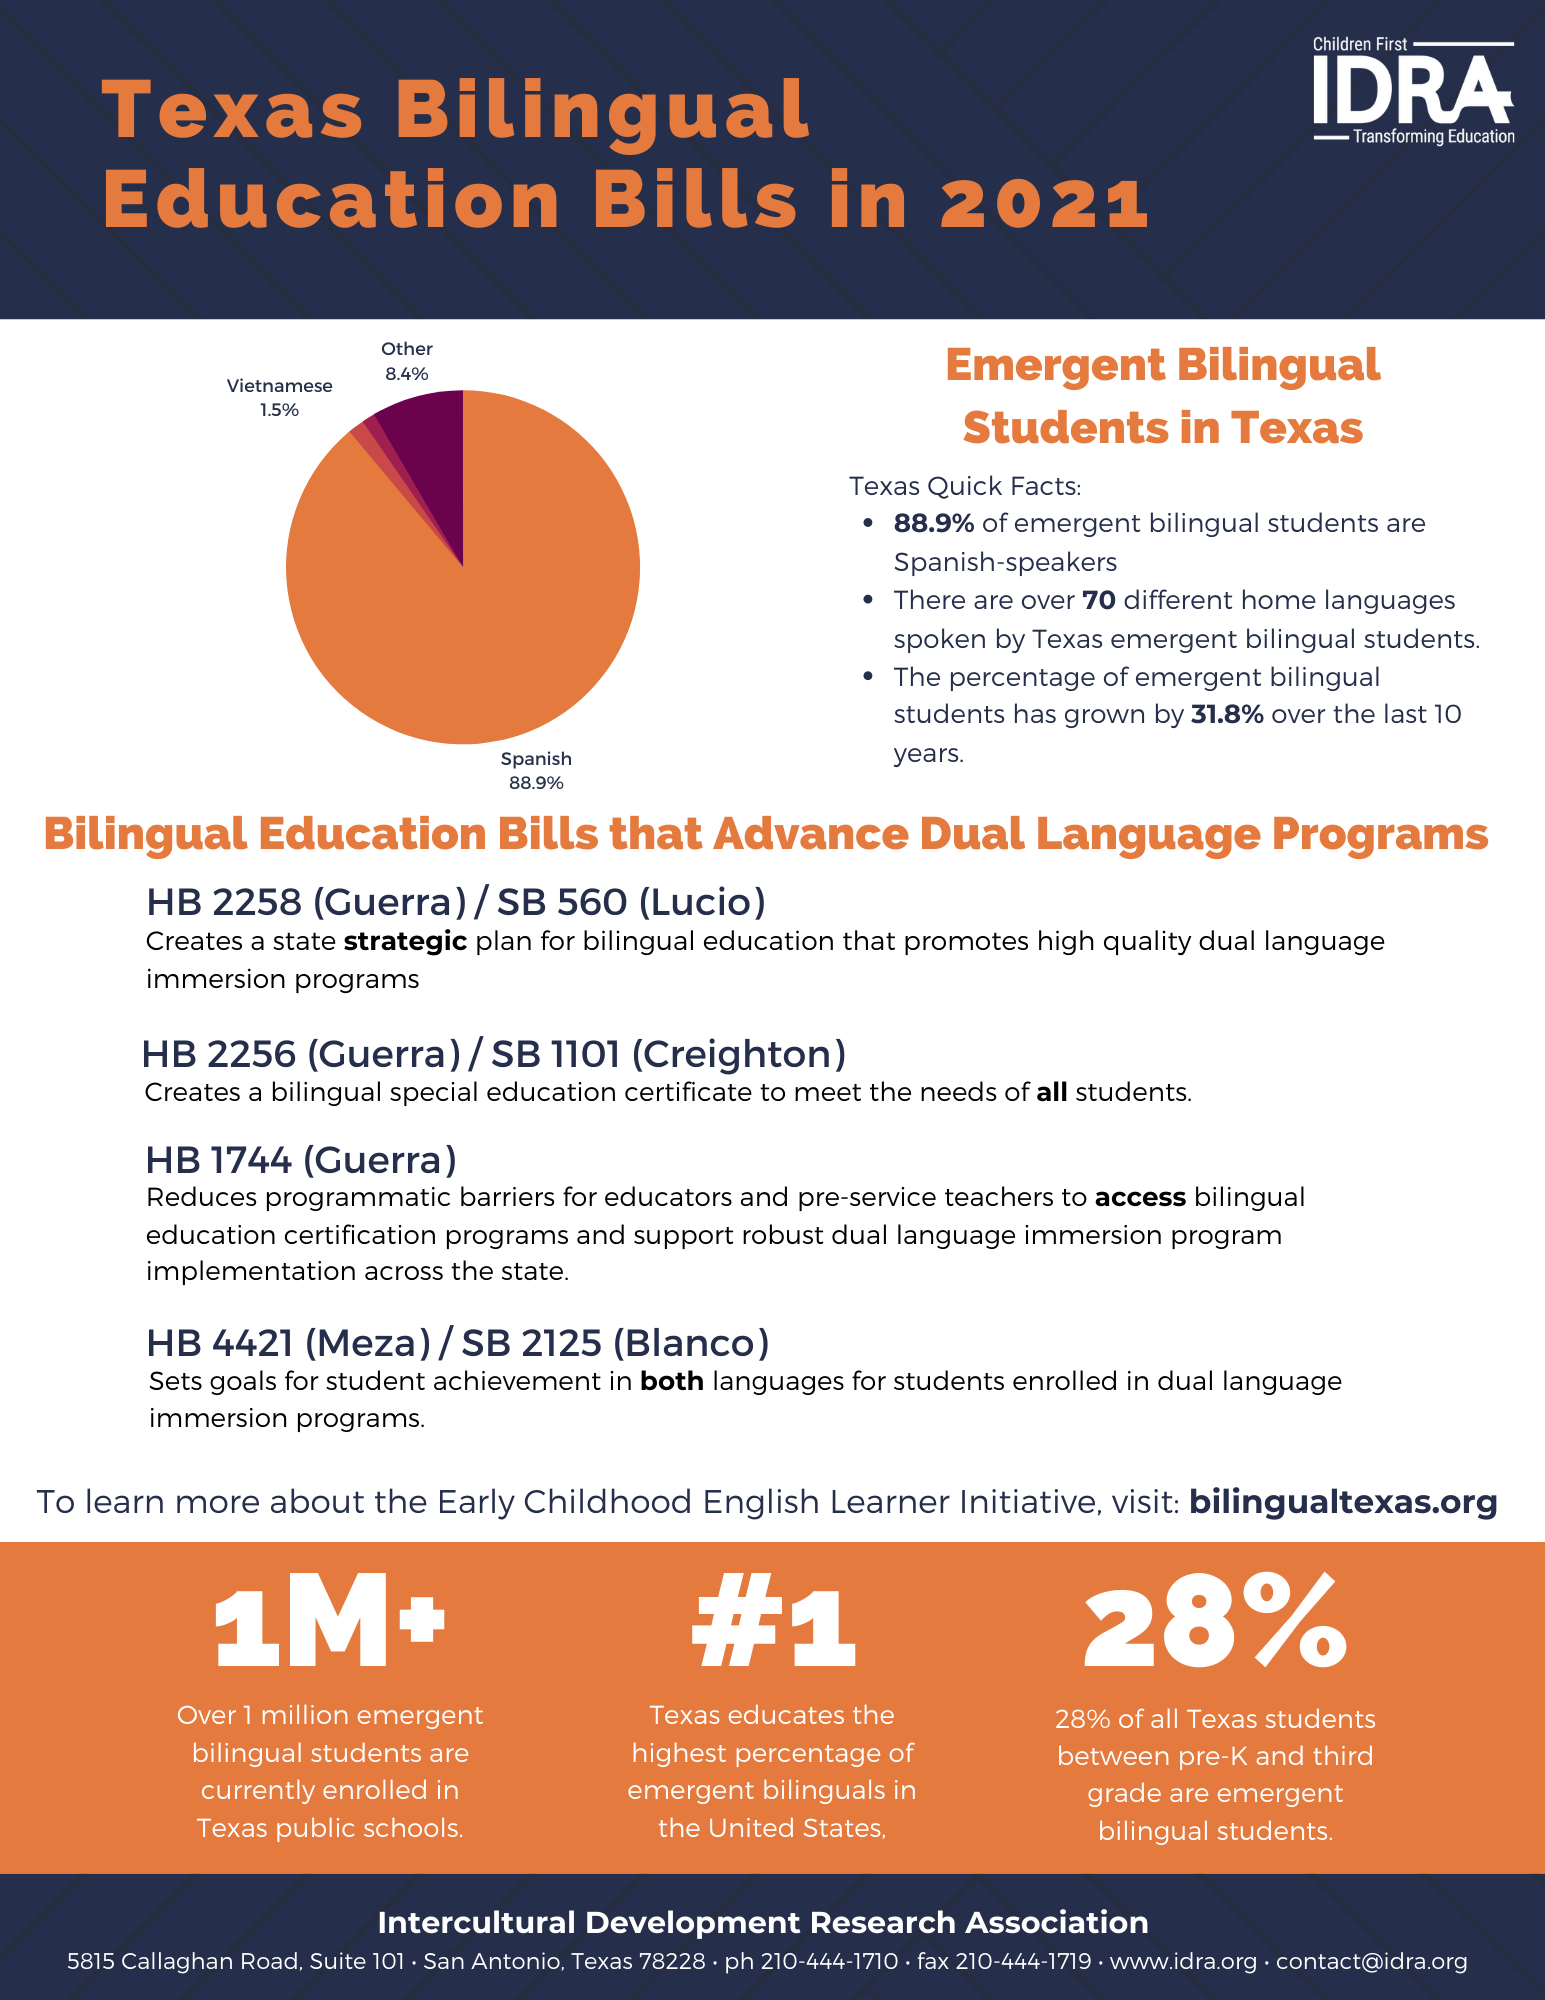
Over 1 million emergent bilingual students are currently enrolled in Texas public schools. Texas educates the highest percentage of emergent … read more
School Climate Affects LGBTQ Student Well-being – Infographic
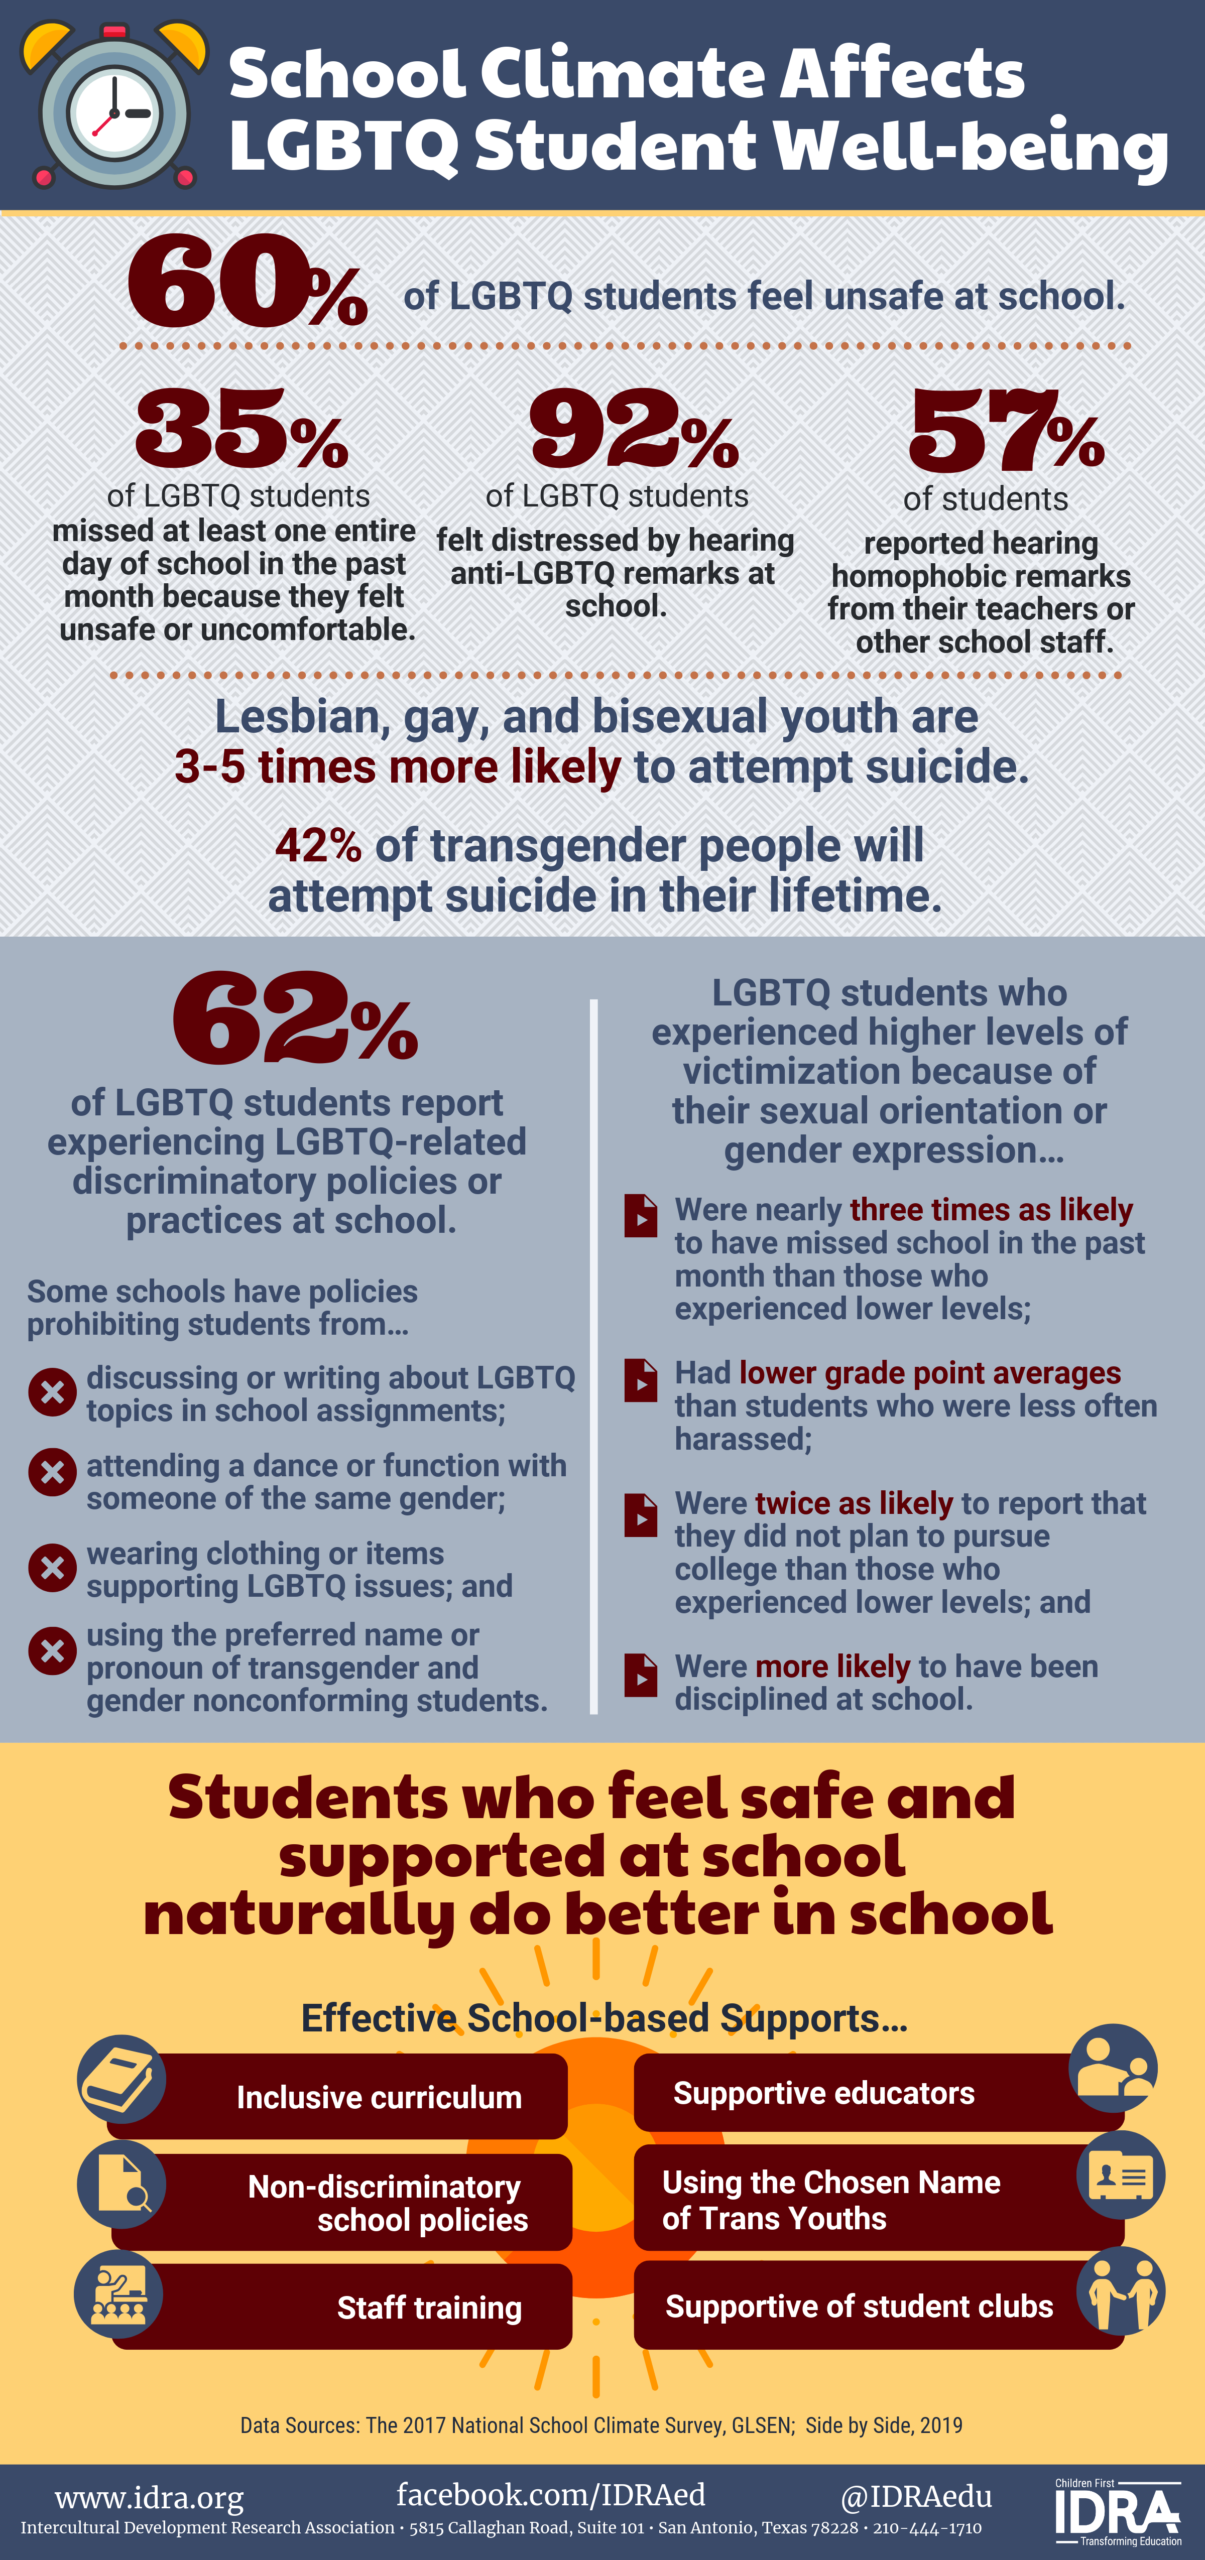
See highlights from the 2017 National School Climate Survey by GLSEN, a presentation by Side by Side (2019), and a … read more
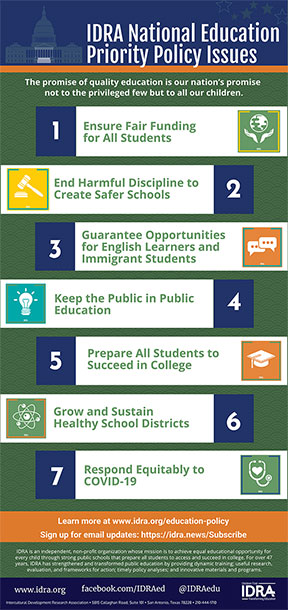
IDRA National Education Priority Policy Issues – Infographic
IDRA’s national policy work brings research, data, and student and family experience to federal bodies to ensure equitable policymaking at … read more
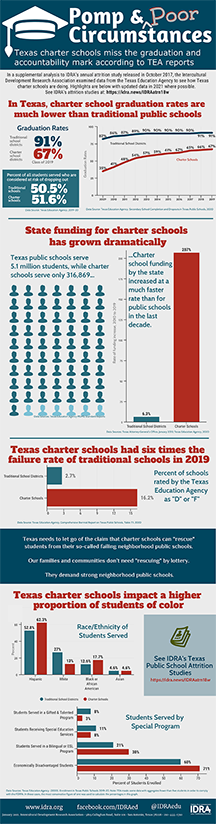
Pomp and Poor Circumstances – IDRA Charter School Study – Infographic
Texas students in charter schools are not necessarily faring better than their peers in traditional public schools. With significantly lower … read more

A College Degree Makes a Difference in Life – Infographic
College access and preparation are vitally important to help students thrive. The data show it is critical to encourage college … read more
