Infographics

Use of Individual Graduation Committees Unlocks Diplomas for 14,422 Qualified Students in Texas – Infographic
Texas’ temporary policy relieved high-stakes for 14,422 students according to IDRA’s analysis. Students who are economically disadvantaged, Latino or African … read more
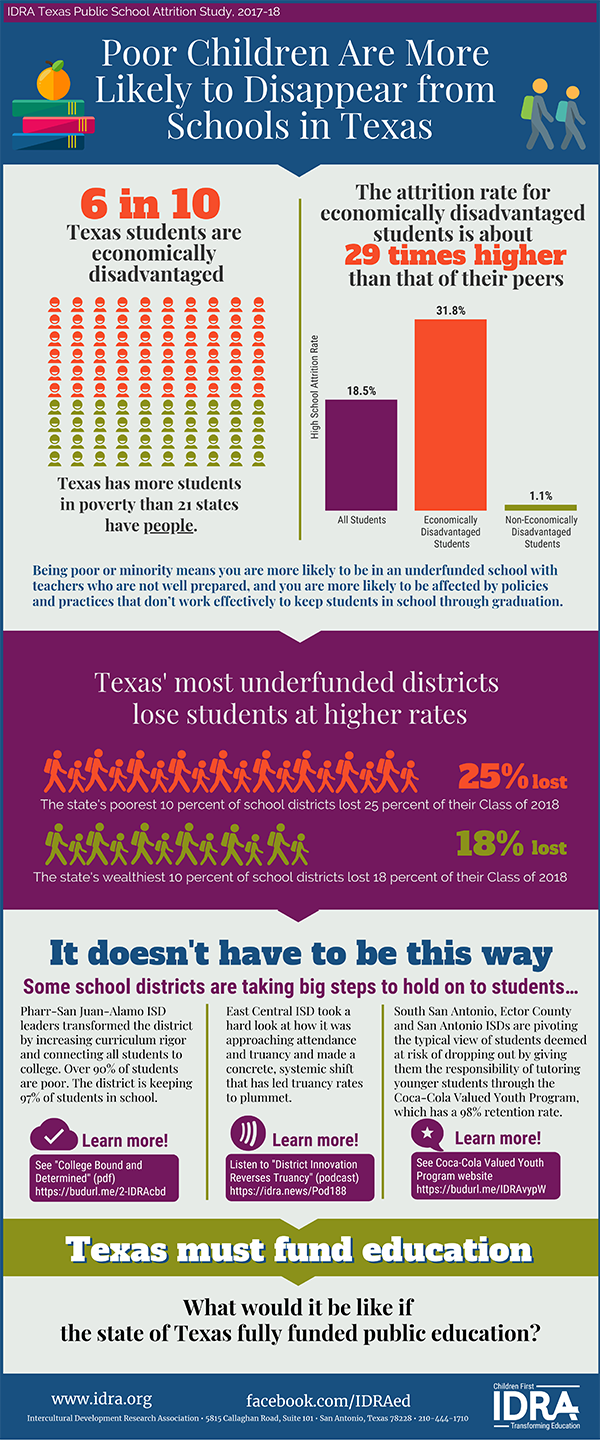
Poor Children Are More Likely to Disappear from Schools in Texas – Infographic
In an additional analysis to IDRA’s annual attrition study released in December 2018, IDRA examined data from a national and … read more
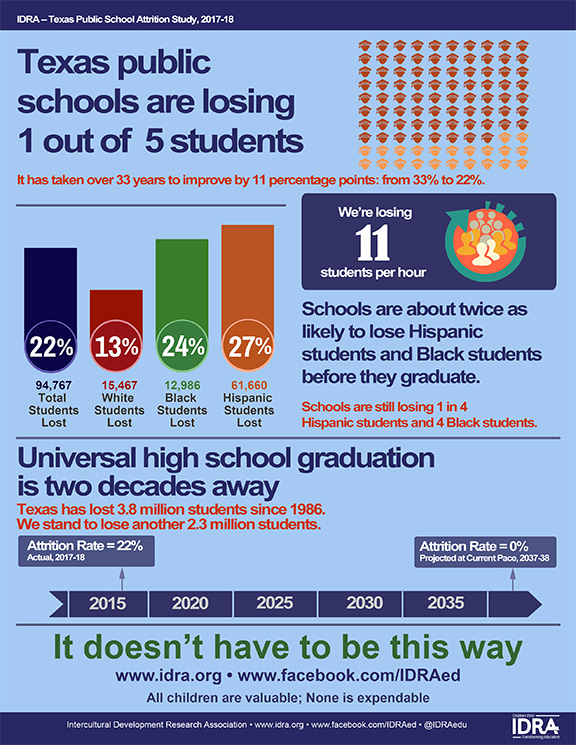
Texas High Schools Lost 1 in 5 Students Last Year – Texas Public School Attrition Study 2017-18 – Infographic
IDRA’s 2016-17 high school attrition study today shows: Texas is failing to graduate one out of every five students – … read more

College Readiness Gaps – IDRA Infographic
There has been a 25.5% increase in the number of students taking the ACT from 2012 to 2016. 64% of … read more
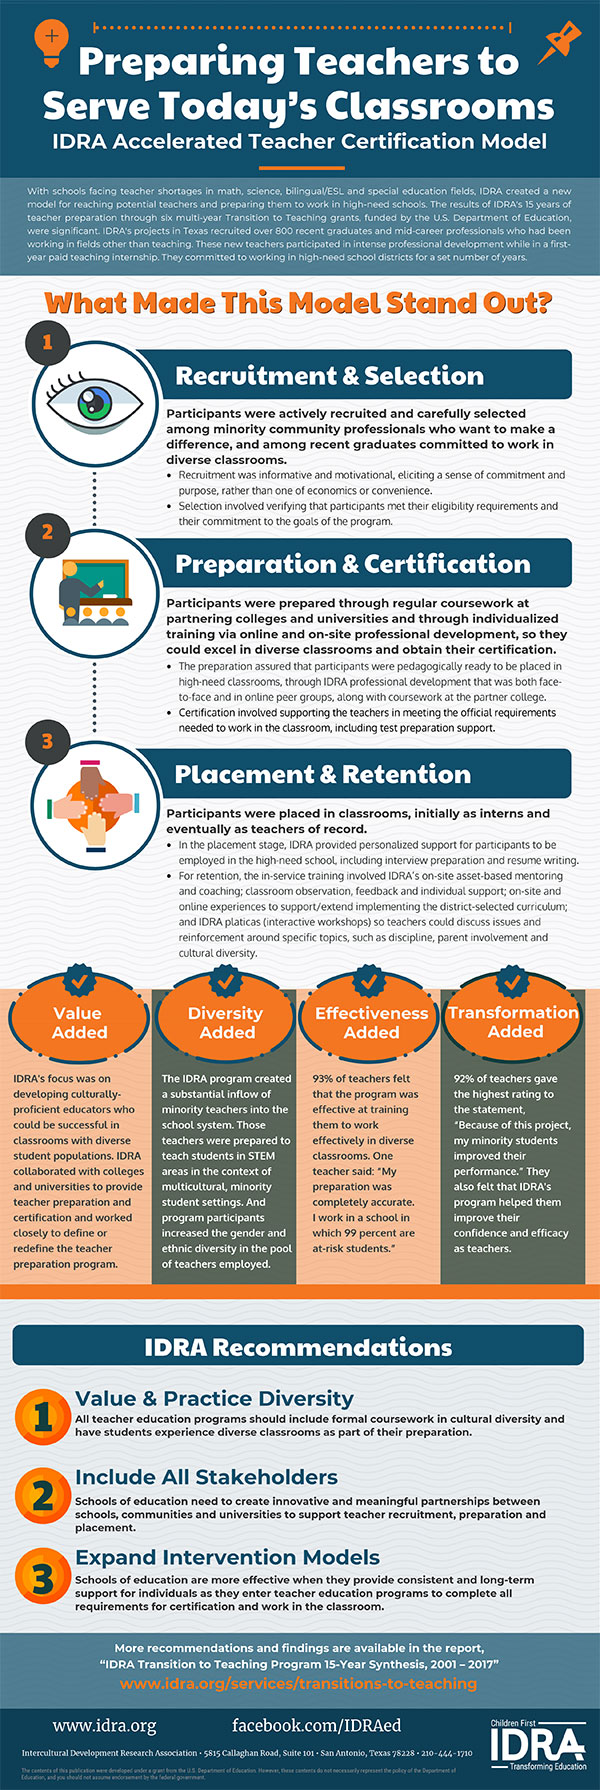
Preparing Teachers to Serve Today’s Classrooms – Infographic
With schools facing teacher shortages in math, science, bilingual/ESL and special education fields, IDRA created a new model for reaching … read more

Ready Texas Graduation Requirements Study – Infographic
In 2013, Texas made the most substantial changes to graduation requirements & school curricula in recent history. House Bill 5 … read more

Attrition Reaches All-Time Low of 29% for Hispanic Students – Texas Public School Attrition Study 2016-17 – Infographic
IDRA’s 2016-17 high school attrition study today shows: Texas is failing to graduate one out of every four students – … read more

5 Reasons Research Shows Teacher Leave – Infographic
Each year, more than 200,000 teachers leave the profession, with nearly two out of three leaving for reasons other than … read more

Texas Divestment in Public Education – Infographic
The State of Texas has reduced its share of public education spending during the last decade from 49 percent in … read more