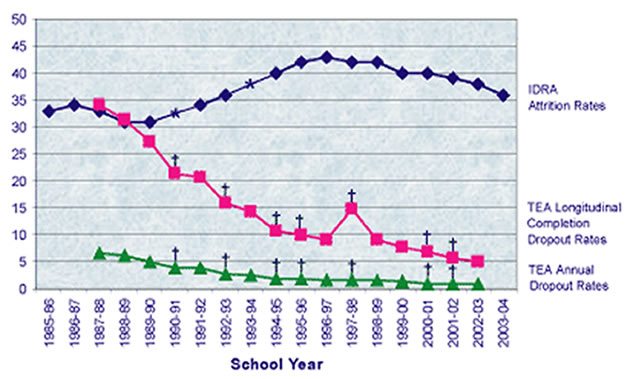
Line graph comparing attrition rates (by IDRA) and dropout rates (by TEA) in Texas over time

| Group | 1985- 86 |
1986- 87 |
1987- 88 |
1988- 89 |
1989- 90 |
1991- 92 |
1992- 93 |
1994- 95 |
1995- 96 |
1996- 97 |
1997- 98 |
1998- 99 |
1999- 00 |
2000- 01 |
2001- |
2002- 03 |
2003- 04 |
Percent |
| Race-Ethnicity | ? | ? | ? | ? | ? | ? | ? | ? | ? | ? | ? | ? | ? | ? | ? | ? | ? | ? |
| Native American | 45 | 39 | 37 | 47 | 39 | 40 | 39 | 42 | 44 | 43 | 42 | 25 | 43 | 42 | 29 | 39 | 42 | -7% |
| Asian/Pacific Islander | 33 | 30 | 28 | 23 | 22 | 21 | 21 | 18 | 18 | 20 | 21 | 19 | 20 | 20 | 14 | 17 | 16 | -52% |
| Black | 34 | 38 | 39 | 37 | 38 | 39 | 43 | 50 | 51 | 51 | 49 | 48 | 47 | 46 | 46 | 45 | 44 | 29% |
| White | 27 | 26 | 24 | 20 | 19 | 22 | 25 | 30 | 31 | 32 | 31 | 31 | 28 | 27 | 26 | 24 | 22 | -19% |
| Hispanic | 45 | 46 | 49 | 48 | 48 | 48 | 49 | 51 | 53 | 54 | 53 | 53 | 52 | 52 | 51 | 50 | 49 | 9% |
| Gender | ? | ? | ? | ? | ? | ? | ? | ? | ? | ? | ? | ? | ? | ? | ? | ? | ? | ? |
| Male | 35 | 35 | 35 | 34 | 34 | 37 | 39 | 43 | 45 | 46 | 45 | 45 | 44 | 43 | 43 | 41 | 40 | 14% |
| Female | 32 | 32 | 31 | 29 | 29 | 30 | 33 | 37 | 39 | 40 | 38 | 38 | 36 | 36 | 35 | 34 | 33 | 3% |
| Total | 33 | 34 | 33 | 31 | 31 | 34 | 36 | 40 | 42 | 43 | 42 | 42 | 40 | 40 | 39 | 38 | 36 | 9% |
|
*Rounded to nearest whole number. Figures calculated by IDRA from the Texas Education Agency Fall Membership Survey data. |
||||||||||||||||||

