Infographics
How to Hold a Virtual Town Hall – Infographic
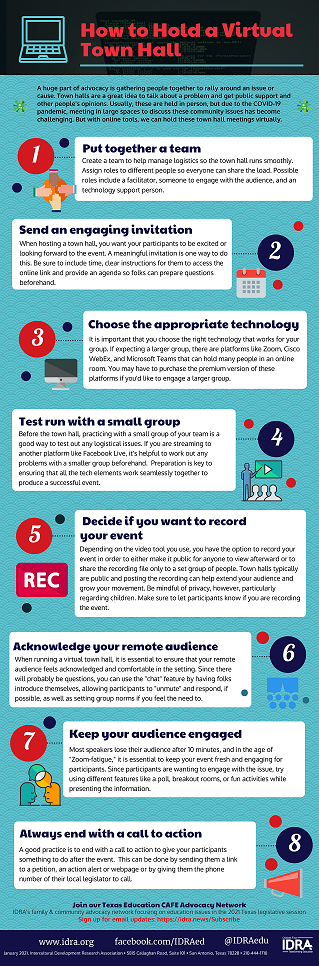
A huge part of advocacy is gathering people together to rally around an issue or cause. Town halls are a … read more
5 Tips for Organizing a High School Student-Led Ethnic Studies Advocacy Group – Infographic
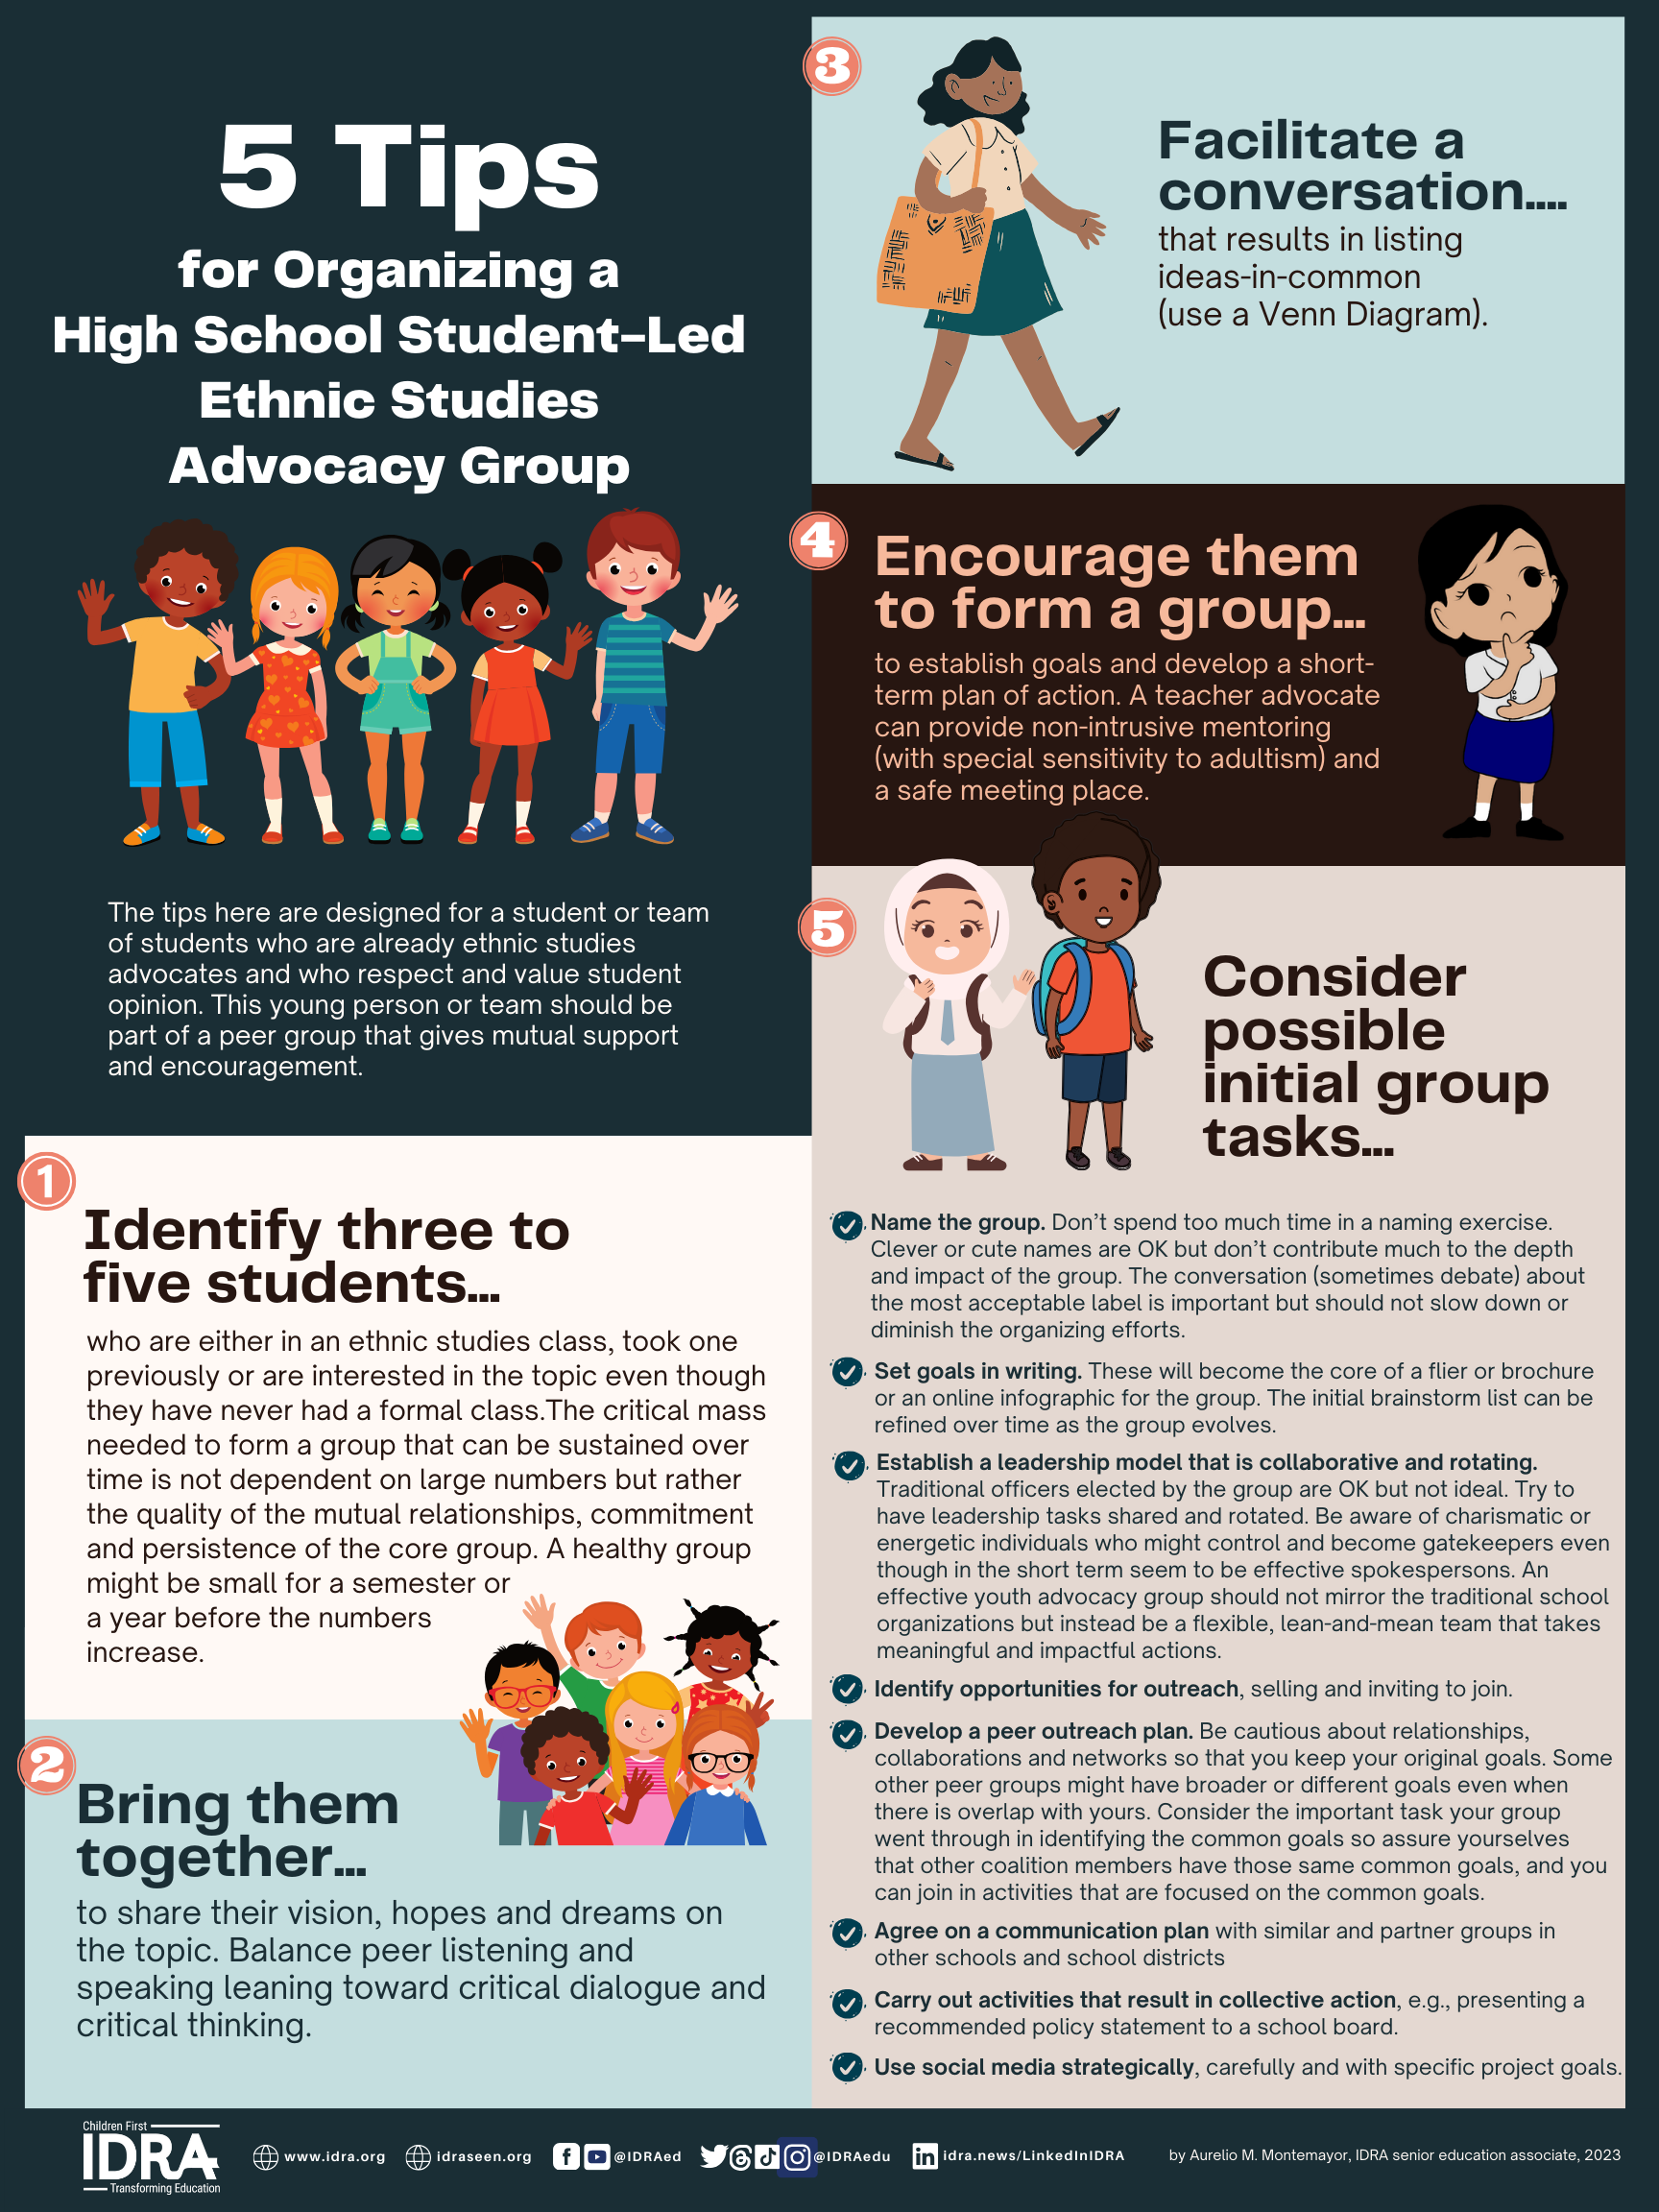
The tips here are designed for a student or team of students who are already ethnic studies advocates and who … read more
Texas State Divestment of Education – Infographic
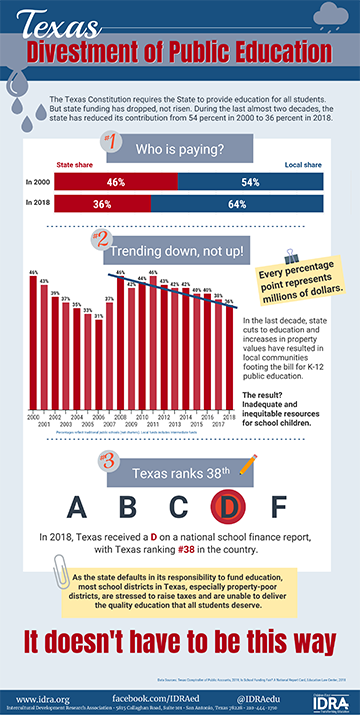
The Texas Constitution requires the State to provide education for all students. But state funding has dropped, not risen. During … read more
More Ready Texas with Middle School Counselors – Infographic
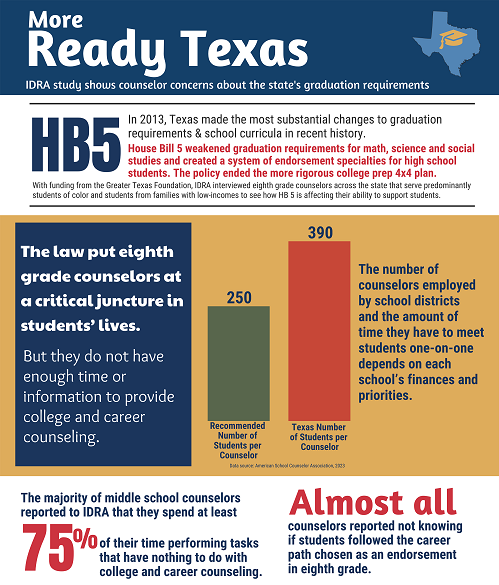
IDRA study shows counselor concerns about the state’s graduation requirements In 2013, Texas made the most substantial changes to graduation … read more
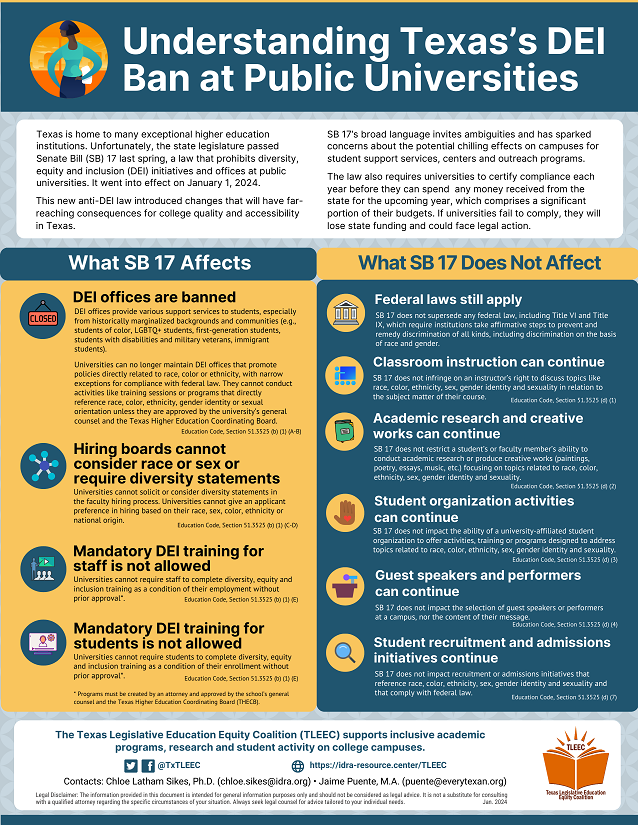
Understanding Texas’s DEI Ban at Public Universities – Infographic
Texas is home to many exceptional higher education institutions. Unfortunately, the state legislature passed Senate Bill (SB) 17 last spring, … read more
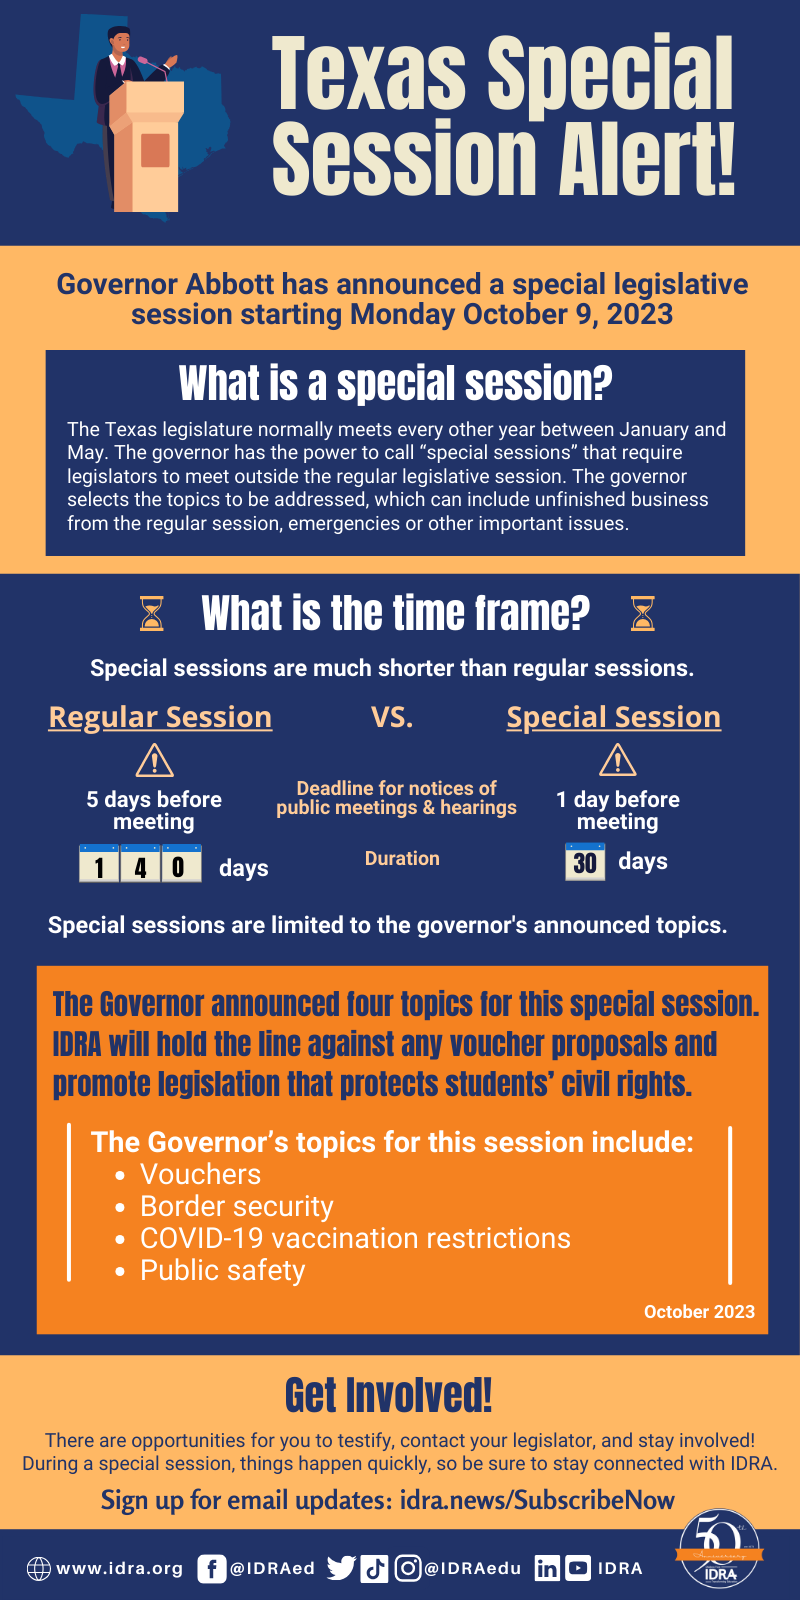
Texas Special Session Alert – Infographic
Governor Abbott has announced a special legislative session starting Monday October 9, 2023. This infographic discusses what a special is … read more
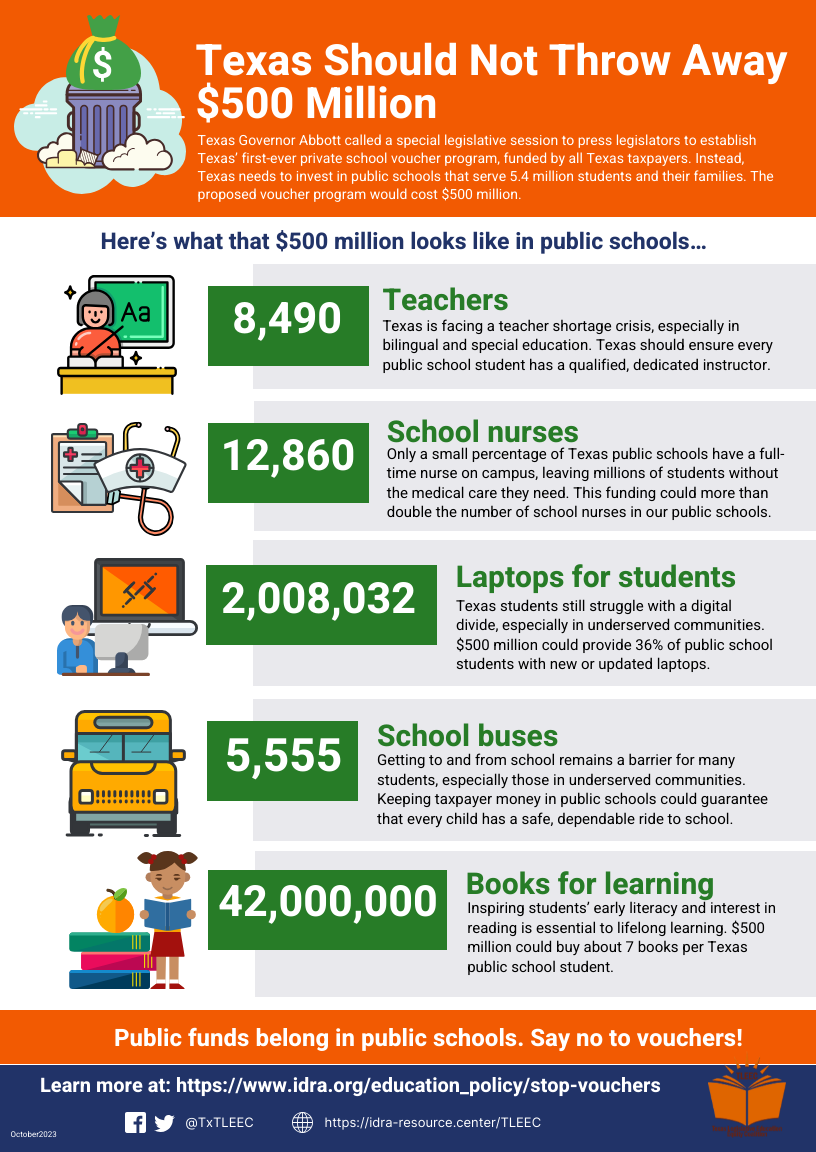
Texas Should Not Throw Away $500 Million – Infographic
Texas Governor Abbott called a special legislative session to press legislators to establish Texas’ first-ever private school voucher program, funded … read more
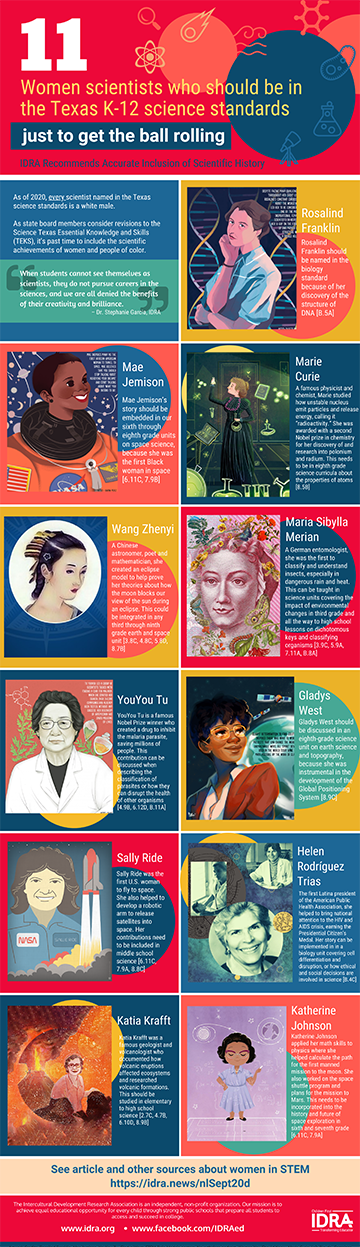
11 Women scientists who should be in the Texas K-12 science standards, just to get the ball rolling – Infographic
As the Texas State Board of Education began to consider revisions to the Science Texas Essential Knowledge and Skills (TEKS) … read more
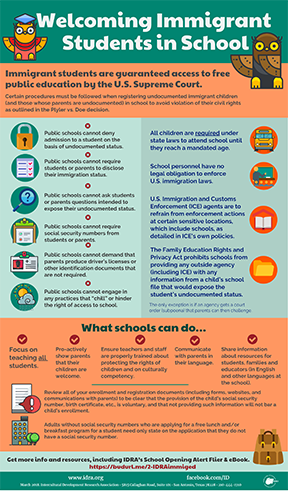
Welcoming Immigrant Students in School – Infographic
As schools are registering students for the next school year, IDRA is releasing this new infographic as a reminder that … read more
