
The U.S. Department of Education’s National Center for Education Statistics (NCES) is the principal federal agency responsible for the collection, analysis and reporting of data on the condition of education in the United States. Dropout data from NCES examines rates within racial and ethnic groups, across gender groups, and across states and geographical regions. NCES defines the various types of dropout rates as stated below.
The five NCES rates (the averaged freshman graduation rate, the event dropout rate, adjusted cohort graduation rate, the status dropout rate, and the status school completion rate) and along with other traditional measures, such as the attrition rate and cohort dropout rates, provide unique information about high school dropouts, completers and graduates. Different states use various measures.
The Texas Education Agency reports an annual dropout rate; longitudinal graduation, completion and dropout rates and attrition rate.
Though each rate has different meaning and calculation methods, each provides unique information that is important for assessing schools’ quality of education and school holding power.
Within these types of data are underlying questions of who is included in the data pool. For example, are students who drop out to earn a GED counted as dropouts? Are students who complete their coursework but are denied a diploma for failing to pass a state exit exam counted as dropouts?
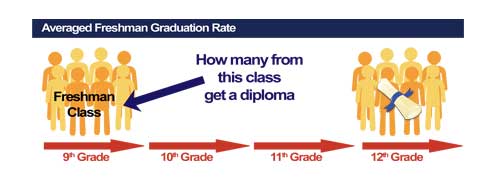
Averaged freshman graduation rates describe the proportion of high school freshmen who graduate with a regular diploma four years after starting ninth grade. This rate measures the extent to which schools are graduating students on time. The first school year for which NCES provides averaged freshman graduation rates is 2001-02.

Adjusted cohort graduation rates describe the proportion of high school freshmen who graduate with a regular diploma four years after starting ninth grade (or 10th grade in high schools that begin with the 10th grade). This rate measures the extent to which schools are graduating students on time, but it also takes into account students who transfer into or out of a school in the state or who die.
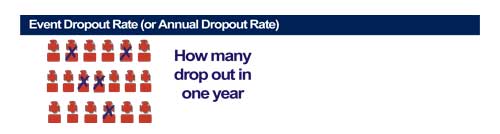
Event dropout rates describe the percentage of private and public high school students who left high school in a particular year (between the beginning of one school year and the beginning of the next) without earning a high school diploma or its equivalent. This rate is also referred to as an annual dropout rate. The Texas Education Agency reports the event rate (in addition to other rates). Definitions for TEA rates can be found on the TEA website.
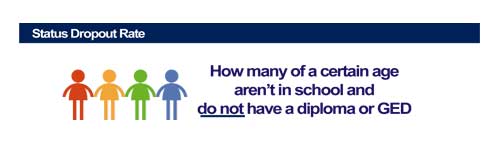
Status dropout rates provide cumulative data on dropouts among young adults within a specified age range (usually: 15 to 24 years of age, 16 to 24 years of age, or 18 to 24 years of age). They measure the percentage of individuals who are not in school and have not earned a high school diploma or equivalency, irrespective of when they dropped out. These rates, which are higher than event rates because they include all dropouts, reveal the extent of the dropout problem in the population. (This rate focuses on an overall age group or cohort rather than on individuals.)
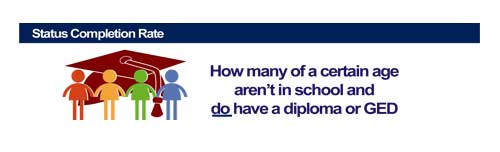
High school status completion rates describe the proportion of individuals in a given age range who are not in high school and who have earned a high school diploma or equivalency credential (namely the GED certificate), irrespective of when the credential was earned. (This rate also is referred to as the “school completion rate” as the positive way of expressing the status dropout rate.)
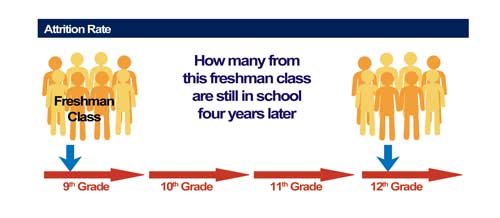
Attrition rates measure the number of students lost from enrollment between two points in time (e.g., ninth grade and 12th grade enrollment four years later). Attrition data are similar to cohort data. Each year for the state of Texas, TEA reports a simple attrition rates, while IDRA reports adjusted attrition rates (that account for fluctuations in school enrollment and in and out migration).
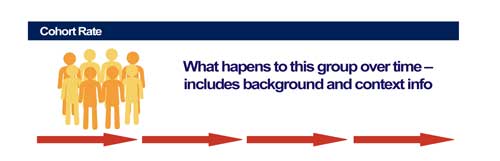
Cohort rates measure what happens to a cohort of students over a period of time. These rates provide repeated measures of a group of students starting at a specific grade level over time. These measures provide longitudinal data on a specific group of students, including background and contextual data.
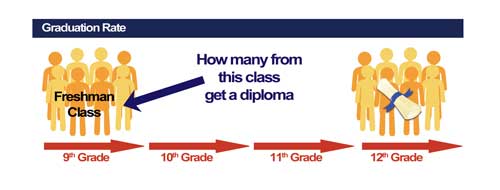
Graduation rates measure the percentage of students from a class of beginning seventh or ninth graders who graduate with a high school diploma.
Also see “Understanding High School Graduation Rates in the United States” by the Alliance for Excellent Education (pdf)
