HB 121 – Cost Study of Bilingual/ESL and Compensatory Education
IDRA Testimony – Presented by David Hinojosa, J.D., National Director of Policy, Before the Texas House Public Education Committee, July 25, 2017
See PDF version (with full attachments)
Chairman Huberty and Members of the Committee:
Thank you for allowing the Intercultural Development Research Association (IDRA) the opportunity to present written testimony of its research and analysis on school finance and cost studies for economically disadvantaged and English learner students.
IDRA is an independent, non-profit organization that is dedicated to assuring equal educational opportunity for every child through strong public schools that prepare all students to access and succeed in college. Since its founding in 1973, IDRA has conducted extensive research and analysis on Texas school finance, including cost studies, which have been used to help inform policymakers for the past five decades.
Strong, recent research shows that increased funding by the states has contributed to both improved student performance and lifetime outcomes, especially for underserved students (Jackson, et al., 2016; Lafortune, et al., 2016). Cost studies enable legislators to bridge educational funding policy with effective research and practice.
Yet, Texas has historically funded its public schools based on available appropriations and politicking as opposed to actual student need. Consequently, Texas’s school finance system remains largely inequitable for its low-wealth school districts and, across Texas, inadequate for its special populations, including English learner (EL) students and students from economically disadvantaged families (ED), or low-income students.
History of Funding- Bilingual/ESL Education and Compensatory Education
In the 1970s, IDRA engaged in a bilingual education cost study using an expert panel methodology to identify what practitioners in the field of bilingual education considered to be critical elements of an effective bilingual education program. These included: student assessment, program evaluation, supplemental curricular materials, staffing, staff development and parent involvement. In the IDRA bilingual education cost model, only those costs unique to the implementation of the specialized program were considered (Robledo & Cortez, 2008).
IDRA researchers collected actual cost information on the various components and developed an actual dollar cost figure for program delivery. The bilingual education cost levels varied slightly depending on the grade levels involved and the number of years a program had been in existence, with newer programs reflecting slightly higher costs for start-up (Robledo & Cortez, 2008).
Around the same time, the Governor’s Office of Educational Research and Planning conducted an audit of exemplary school districts, resulting in a recommendation for a “beginning” bilingual weight of (0.15) for bilingual education programs, with an increase to (0.4) in two years. The Governor’s bill was defeated and the allotment was set at $50 for each student in a bilingual program and $12.50 for each student in an English as a second language class (Dietz, 2004).
In 1984, the legislature convened a school finance working group to study school finance, including the weights. The working group consisted of educators, school leaders, and legislators, among others. After examining the essential services and programs required to assist EL and ED in meeting state expectations and standards for students, the group recommended a (.4) weight for both bilingual education and compensatory education. While the legislature rejected the proposed weights and arbitrarily set the bilingual weight to (.1) and the compensatory weight to (.2), importantly the legislature went to a weighted system tying the additional funding to the regular program allotment.
In 2004, the state commissioned a cost-function study that analyzed low student passage rates on the state assessment. The state study concluded that it would take an additional $1,248 to assist an EL student who failed to pass the state assessment and an additional $1,960 to assist an economically disadvantaged student who failed to pass the state assessment. The state did not adjust the weights upward in response to the study (Dietz, 2004).
Performance and Need
Over 30 years later, the weights remain unchanged but the standards and expectations for students and schools continue to evolve. Attached you will find longitudinal demographic information for EL and ED students, as well as the most recent STAAR student group performance rates, college readiness outputs, graduation rates and dropout rates (Appendix A). This data reflects significant gaps between ED and non-ED students and EL and non-EL students. In spite of success individual ED and EL students are experiencing in classroom across Texas, the data show significant challenges facing our schools today. With such great and immediate need, there appears no reason why the weights should not increase significantly for the next biennium while a cost study is being conducted to determine the more precise weights.
In 2016, IDRA identified six state policies contributing to higher student dropout rates and two of these policies – unfair funding and low funding and insufficient support for EL students – directly implicate school finance (the other four are in-grade retention policies, zero tolerance policies, watered-down, non-college prep curriculum and high stakes testing).
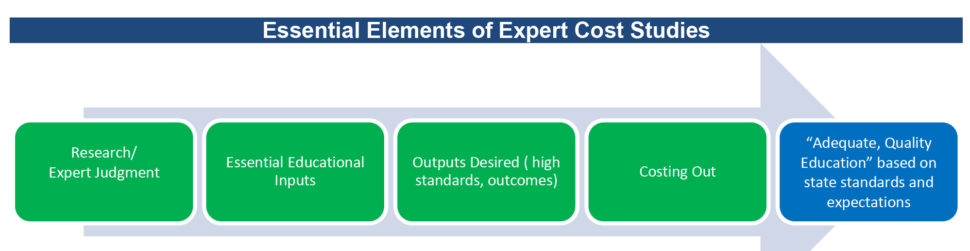
Expertly-designed and well-supported cost studies that follow the essential elements below can help provide the legislature with critical information that can enable it to support a high-quality education for the state’s growing EL and ED students.
Cost Studies Across the States
More than 50 cost studies have been conducted across the states. These studies range in terms of rigor and quality with each having their strengths and weakness from which Texas can pull. Several of them have considered the education of ED and EL students, but the way the studies approach underserved student population also can vary. In addition, IDRA is attaching as Appendix B a preliminary listing of EL/ED funding across the states.
| Major Types of Education Cost Studies | ||
| Type | Methodology | State Examples* |
| Cost-function | determines how much a district would need to spend to reach a certain performance target, in light of particular student characteristics. | Arizona, California, Georgia, Kansas, Missouri, New York, Texas |
| Evidence-Based | Relies on a combination of effective schools research in tandem with expert panels to define and cost out “effective” educational practices. | Arizona, Arkansas, Kentucky, Maine, Maryland, New Jersey, North Dakota, Ohio, Oregon, Vermont, Washington, Wisconsin, Wyoming, Texas |
| Expert/Professional Judgment | gathers input from groups of experienced education professionals (teachers, administrators, special program designers, etc.) and/or experts on the essential components necessary for a particular type of program, followed by collection of data on the actual dollar costs of those services. Often reviewed by panel of external experts. | Colorado Indiana, Kansas Kentucky, Maryland, Missouri, Montana Nebraska, New Mexico, North Dakota, Oregon, South Carolina, Washington, New York |
| Successful Schools/Districts | based on data on existing school operations, followed by development of costs actually experienced in those settings. | Ohio, Mississippi, Illinois, Maryland, Kansas, Louisiana, Colorado, Missouri, New Hampshire, New York |
| *State examples derived in part from (Rebell, 2005). | ||
Potential Impact of Basing Cost of Expert Research and Studies
The cost study findings could lead to much better support and meaningful opportunities for school children. In 2012, IDRA conducted an analysis of how much more revenue would be generated per WADA for school districts if the weights were increased to (0.4). The analysis below shows that school districts across Texas and their school children would benefit substantially.
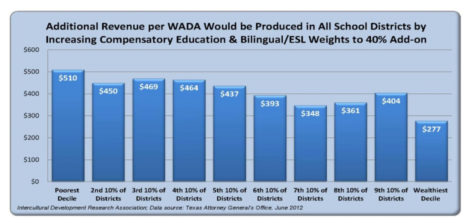
This additional funding could help school districts provide a high-quality education to all learners so long as the funding is carefully monitored. Some research-based examples of programs and services follow.
| Bilingual Education | Compensatory Education |
| Stipends for teachers and principals with bilingual and ESL certification | Stipends for teaching in schools with higher populations of ED students |
| Accelerated learning and high quality tutoring | Accelerated learning and high quality tutoring |
| Content-testing for new students first entering U.S. schools | Socio-economic school integration plans |
| Professional development for all teachers of EL students centered on language/content learning and cultural competency | Professional development for all teachers on cultural competency |
| Coaching and mentoring of teachers | Professional learning communities |
| Local monitoring programs to ensure biliteracy and bilingualism | Block scheduling |
| Smaller class size | Smaller class size |
| Bilingual books, supportive materials and technology, and curriculum | Family engagement |
| High quality pre-K | High quality pre-K |
In addition, if the weights increase as a result of the study, so too would school districts’ WADA counts. Not only would this result in increased funding as noted above, but it also would provide more accurate property values per WADA for which state and local revenues are determined. Below is a general example of how more accurate WADA counts could affect a district’s recapture.
Scenario I Recapture at Copper Penny Level ($319,500)
If I had 5,000 ADA and 20% EL and 60% ED, my WADA would be estimated at
1,000 EL x .1= 100 WADA
3,000 ED x .2= 600 WADA
700 WADA + 5,000 ADA= 5,700 WADA
If the weights for the bilingual allotment and compensatory allotment increased to .25:
1,000 EL x .25= 250 WADA
3,000 ED x .25= 750 WADA
1,000 WADA + 5,000 ADA= 6,000 WADA
So if my property value was $400,000/WADA under the old weights, based on $2,280,000,000 total property value (5700 WADA x 400,000), it would now be $380,000/WADA under the .25 weights (2,280,000,000/6,000).
My recapture at the copper level of $319,500 would be reduced roughly 25% under this scenario (400,000-319,500/380,000).
IDRA thanks this committee for the opportunity to testify and stands ready as a resource. If you have any questions, please contact IDRA’s National Director of Policy, David Hinojosa, at david.hinojosa@idra.org or 210-444-1710, ext. 1739.
Resources
Cortez, A. (2012). Report of the Intercultural Development Research Association Related to the Extent of Equity in the Texas School Finance System and Its Impact on Selected Student Related Issues, Prepared for the Mexican American Legal Defense and Educational Fund in Texas Taxpayer & Student Fairness Coalition v. Williams, No. D-1-GN-11-003130, Travis Co. District Court (San Antonio, Texas: Intercultural Development Research Association). http://www.idra.org/images/stories/IDRA_School_Finance_Equity_Report_08162012.pdf
Dietz, J.K. (2004). West-Orange Cove Consol. Indep. Sch. Dist. v. Neeley, Findings of Fact and Conclusions of Law, 2004 WL 5719215 (Travis Co. Dist. Ct.).
Jackson, C.K., Johnson, R., & Persico, C. (2016). The Effects of School Spending on Educational and Academic Outcomes: Evidence from School Finance Reforms, Quarterly Journal of Economics, Vol. 131(1), pp 157-218.
Lafortune, J., Rothstein, J., & Whitmore Schanzenbach, D. (2016). School Finance Reform and the Distribution of Student Achievement, NBER Working Paper No. 22011 (Cambridge, Mass.: National Bureau of Economic Research).
Rebell, M. (2005). A Costing Out Primer (New York, NY: Campaign for Fiscal Equity, Inc.).
Robledo Montecel, M., & Cortez, A. (2008). “Costs of Bilingual Education,” in Encyclopedia on Bilingual Education (Vol. 1, pp. 180-183). Sage Publications.
The Intercultural Development Research Association is an independent, non-profit organization led by María Robledo Montecel, Ph.D. Our mission is to achieve equal educational opportunity for every child through strong public schools that prepare all students to access and succeed in college. IDRA strengthens and transforms public education by providing dynamic training; useful research, evaluation, and frameworks for action; timely policy analyses; and innovative materials and programs.
| Appendix B: Preliminary Listing of EL/ED Funding, State Comparison | ||||
| State | Weight Target (ED/EL) | Weight Amt (ED) | Weight Amt (ELL) | Weight Multiplier/Qualifying Basis |
| Alabama | ED/ELL | Based on prior year ESL allocations; categorical aid | ||
| Alaska | ELL | 0.2 | Foundation | |
| Arizona | ED/ELL | 0.115 | Foundation | |
| Arkansas | ELL | Categorical funding formulas | $305 per pupil | State appropriation |
| California | ED/ELL | 0.2 | Foundation and added entitlement formulas | |
| Colorado | ED | Categorical funding | ||
| Connecticut | ED/ELL | 0.15 | Foundation | |
| Delaware | ED/ELL | Unit for Academic Excellence funding- not targeted | ||
| Florida | ELL | 0.147 | Foundation | |
| Georgia | ED/ELL | 0.3092-1.4717 | 2.5068 | Foundation- ED funding varies between remedial and alternative education; ELL funding based on ESOL program enrollment |
| Hawaii | ED/ELL | 0.1 | 0.18 | Foundation, and formula based on combined district cost and modified allowable growth |
| Idaho | ELL | $263 per pupil | State appropriation and additional district grants | |
| Illinois | ED/ELL | Grants formula funding | ||
| Indiana | ED/ELL | Grants formula funding | ||
| Iowa | ED/ELL | 0.22 | Grant formula for ED/ ELL Foundation weight | |
| Kansas | ED/ELL | 0.456 | 0.395 | Foundation and formulas |
| Kentucky | ED | 0.15 | 0.096 | Foundation |
| Louisiana | ED/ELL | 0.22 | 0.22 | Foundation |
| Maine | ED/ELL | 0.15 | 0.525-0.7 | Foundation, ELL weight depending on density |
| Maryland | ED/ELL | Grants formula funding | ||
| Massachusetts | ED/ELL | $2,767-3,422 per pupil | $637-2,325 per pupil | Foundation |
| Michigan | ED/ELL | 0.115 | $1.2M State appropriation distributed per pupil | Foundation and annual cap/Biennium budget |
| Minnesota | ED/ELL | 1.00 (free lunch) & 0.5 (reduced) | $700 per pupil times the greater of 20 or the number of eligible ELLs | Foundation, and formula of concentration of FRL students on a campus |
| Mississippi | ED | 0.05 | Foundation | |
| Missouri | ED/ELL | 0.25 | 0.6 | Foundation |
| Montana | ED | Limited appropriation | ||
| Nebraska | ED/ELL | .05-0.3 | 0.25 | Foundation |
| Nevada | ELL | $24.95 M | State appropriation | |
| New Hampshire | ELL | $1,749.15 per pupil add’l | $684.45 per pupil | Additional to state allotment |
| New Jersey | ELL | 0.47-0.57 | 0.5 | Foundation |
| New Mexico | ELL | 0.5 | Foundation | |
| New York | ED/ELL | 0.5 | Cost index funding/Foundation | |
| North Carolina | ED/ELL | $200 per pupil | Formula funding | |
| North Dakota | ELL | 0.025 | 0.2-0.3 | Foundation, depending on ELL student language ability |
| Ohio | ED/ELL | $269 calculated with poverty index | Formula funding for ED/ELL | |
| Oklahoma | ED/ELL | 0.25 | 0.25 | Foundation |
| Oregon | ED/ELL | 0.25 | 0.5 | Foundation |
| Rhode Island | ED | 0.4 | Foundation | |
| South Carolina | ED | $79.55M | 0.2 | State appropriation and formula weights |
| South Dakota | 0.25 | Foundation | ||
| Tennessee | ED/ELL | Formula funding and teacher ratios | ||
| Texas | ED/ELL | 0.2 | 0.1 | Foundation |
| Utah | ELL | $1.2M | State appropriation for at-risk students | |
| Vermont | ED/ELL | 0.25 | 0.45 | Foundation |
| Virginia | ED/ELL | State payments | ||
| Washington | ED/ELL | $460 per pupil | $885.91 per pupil | Additional to state allotment based on formulas |
| Wisconsin | ED/ELL | $109.2 M | $8.6 M | Biennium Categorical aid |
| Wyoming | ED/ELL | Formula funding for state restricted grants | ||
| Source: Verstegen, D. (2011). Public education finance systems in the United States and funding policies for populations with special educational needs. Education Policy Analysis Archives, 19(21), 1-30.
Source: IDRA, 2012. “Report of the Intercultural Development Research Association Related to the Extent of Equity in the Texas School Finance System and Its Impact on Selected Student Related Issues.” Source: Rolle, A. and Jimenez-Castellanos, O. (2014). An efficacy analysis of the Texas school funding formula with attention to English Language Learners. Journal of Education Finance, 39(3), 203-221. Source: Verstegen, D. (2015). A 50-state survey of school finance policies. https://schoolfinancesdav.wordpress.com/. Retrieved 6 Mar 2017. Source: Millard, M. (2015). State funding mechanisms for English language learners. Education Commission of the States, http://www.ecs.org/clearinghouse/01/16/94/11694.pdf. Retrieved 6 Mar 2017. |
||||