
• by María Robledo Montecel, Ph.D., and Josie Danini Cortez, M.A • IDRA Newsletter • August 2001
Twenty-five common characteristics contribute to the high academic performance of students served by bilingual education programs. The Intercultural Development Research Association (IDRA) identified these characteristics through funding by the U.S. Department of Education, Office of Bilingual Education and Minority Languages Affairs (OBEMLA). IDRA rigorously and methodically studied exemplary bilingual education programs in schools across the nation as determined by limited-English-proficient (LEP) students’ academic achievement. IDRA now is helping others identify successful programs or raise the bar with their own bilingual education programs.
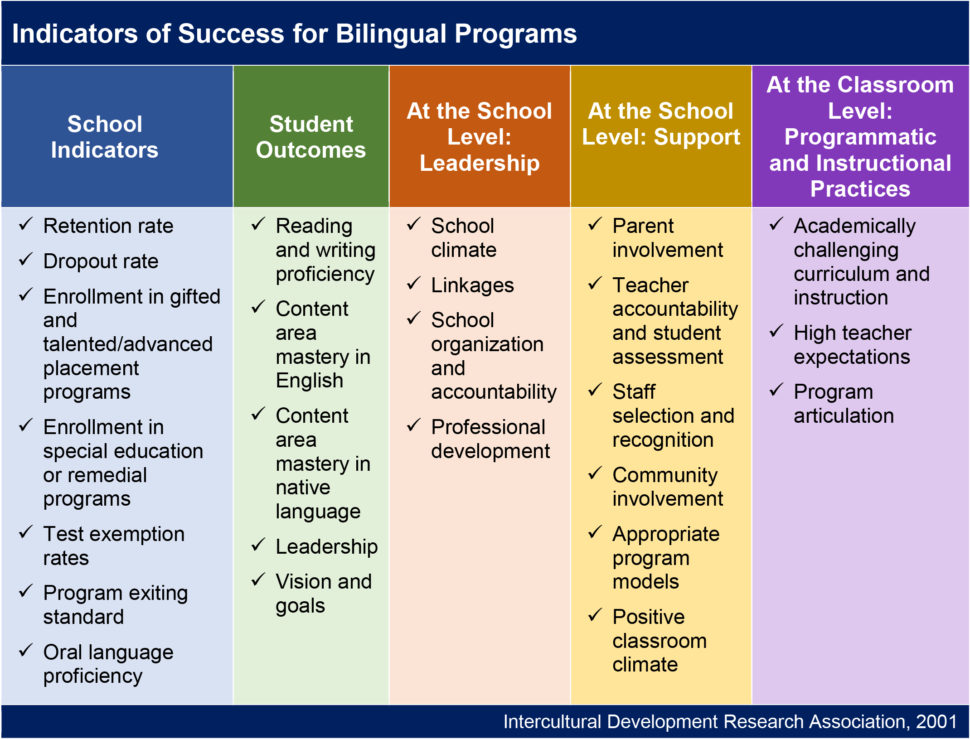
The 25 indicators that emerged from the research were clustered around five domains:
- School Indicators,
- Student Outcomes,
- Leadership,
- Support, and
- Programmatic and Instructional Practices.
This study comes at a critical time. There are an estimated 3.7 million LEP students in the United States, a persistent achievement gap between LEP and non-LEP students, and a critical shortage of bilingual education teachers with the preparation, skills and tools to ensure that all of their students succeed.
Over the next six months, the IDRA Newsletter will feature a series of articles on our research study’s significant findings. The series will provide information on each of the five indicators and outcome standards with first-hand accounts from teachers, administrators, parents and researchers across the country.
We begin the series this month with an overview of the research study. The primary purpose of this study was not to prove that bilingual education works – there are years of rigorous research that prove it does work when implemented with integrity. Instead, the purpose of this research study was to identify those characteristics that are contributing to the high academic performance of students served by bilingual education programs. First, we will present some background information.
Condition of Education for LEP Students
Bilingual Education Act
The Bilingual Education Act (BEA) was first enacted in 1968 as a response to the 80 percent dropout rate of language-minority (Hispanic and Native American) students. California offers an excellent example of the condition of education for language-minority students prior to the Bilingual Education Act.
In 1872, California legislators passed an English-only classroom mandate that lasted 95 years. In 1967, then Governor Ronald Reagan signed Senate Bill 53, repealing the English-only mandate and authorizing bilingual education in California schools.
In his 1999 testimony to the Senate Committee on Health, Education, Labor and Pensions, Dr. Joel Gomez, director of the Institute for Education Policy at the Graduate School of Education and Human Development at George Washington University, cites the reasons for the English-only repeal:
It [the English-only mandate] kept students from learning their academic subjects in a timely fashion; it caused language-minority students to be retained in grade because they were behind in their academic studies; it caused students to become frustrated, to give up and drop out of school. And most ironic of all, English-only instruction did not lead to mastery of the English language.
Prior to the repeal of the English-only mandate in California, only half of the California Mexican-American youth between the ages of 18 and 24 had even completed the eighth grade.
The intent of the 1967 California Bilingual Education Act and the federal version in 1968 was to help states and school districts develop and implement quality education programs for LEP students.
The word “quality” must be underscored for it was the intent that LEP students be afforded an equitable and excellent education, using programs and approaches that would accelerate their academic achievement and performance and hold all students, including LEP students, to high standards.
LEP Enrollment
There were an estimated 3.5 million LEP students in the United States in 1996-97 – a conservative estimate of LEP student enrollment as reported by the nation’s state education agencies that receive Title VII funds. This represents a 6.9 percent increase from the previous year (see below). This is considered a conservative estimate also due to the incomplete response rate of state education agencies to OBEMLA’s annual Survey of States’ Limited English Proficient Students and Available Educational Programs and Services, which is one of the primary methods used to collect data on the number of LEP students in the various states and outlying territories and jurisdictions. For the 1996-97 school year, 54 states or jurisdictions responded to the survey – Pennsylvania, Virginia and West Virginia did not participate nor did American Samoa, Northern Marianas, and Wake Islands.
Confounding the data collection and analyses is the fact that there is no federally mandated definition of limited English proficiency. While the Bilingual Education Act does include an operational definition of “limited English proficiency,” LEP status depends largely on state and local agencies. In the 1996-97 survey, most of the state education agencies based their definitions of limited English proficiency on a combination of a non-English language background and/or difficulties with speaking, reading, writing and understanding English.
LEP Student Assessment
State education agencies use various assessment methods to identify LEP students, including home language surveys (which may be used to identify language backgrounds or determine limited English proficiency), teacher observations, parent information, achievement tests and/or referrals, student records, and teacher interviews. A few states report using between the 30th and 50th percentile cutoff on standardized tests as a criterion for determining limited English proficiency.
Language proficiency tests are also used by states to determine limited English proficiency, including Language Assessment Scales, Idea Oral Language Proficiency Test and the Language Assessment Battery.
The primary reasons that the survey results are incomplete in determining the educational condition of LEP students are the variations in assessment instruments across states and the exemption of LEP students from testing or data not reported by the category of “LEP student.”
Educational Status of LEP Students
With these caveats in mind, the national snapshot of the educational status of LEP students as reported in the survey is dismal:
- Thirty-three states reported that 5.1 percent (37,837) of their LEP students were retained one or more grades the previous year (1995-96). These states reported a total of 740,516 LEP students collectively. This is only 21 percent of the 3.5 million LEP students at the time.
- Thirty-three states reported that 1.7 percent (14,032) of their LEP students dropped out of school the entire year before the survey. Few states even reported any information regarding academic achievement as measured in performance on standardized tests.
- Thirty states reported 19.3 percent (253,763) of LEP students scored below state norms in English reading.
- Thirty states reported 16 percent (211,433) of LEP students scored below state norms in mathematics.
- Eighteen states reported 6.9 percent (52,880) of LEP students scored below state norms in science.
- Seventeen states reported 6.6 percent (51,388) of LEP students scored below state norms in social studies.
LEP Student Services
Forty percent of US teachers reported having LEP students in their classrooms in 1994, but only 29 percent of these teachers had received any training at all in how to serve them. L.T. Diaz-Rico and L. Smith report that between 100,000 to 200,000 bilingual teachers are needed in US classrooms (1994). The critical shortage forces schools to rely on uncertified aides. D. Haselkorn reports that in California, two out of five adults providing bilingual instruction are bilingual aides (1996). In fact, California, the state with the most LEP students, was unable to serve 23 percent of their LEP students in 1995.
This is an important statistic to factor in any assessment of student achievement. The achievement gap between LEP and non-LEP students is indicative that many teachers lack the preparation, skills and tools to ensure that all of their students succeed.
In the year 2000, the numbers of LEP students in California served by bilingual education programs has been dramatically affected by the passage of Proposition 227. In June 1998, California voters passed Proposition 227 that officially mandated an end to bilingual education in that state (with few exceptions). Now, less than 12 percent of LEP students are enrolled in bilingual education programs (California Department of Education). Thus, most LEP students are not receiving the services and programs they need for an equitable and excellent education.
Despite the political and educational realities of California, the country’s leadership is still calling for all students to receive equitable and excellent educational opportunities, including equitable and excellent bilingual education programs.
The importance of this call to action is the underlying premise that native languages and cultures are assets, not deficiencies. English language learners should not have to give up their language, their culture, or their diversity as the price for learning English. The inherent value of all students and their characteristics must be recognized, acknowledged and celebrated. When LEP students walk into a classroom in this country, they should not be limited in their access to an equitable and excellent education. For that to occur, teachers must be prepared to serve them.
Methodology Used for This Study
IDRA had one primary research question: What contributed to the success of a bilingual education classroom as evidenced by LEP student academic achievement?
“Success” was operationally defined as evidence of academic achievement (compared to district and/or state standards) for LEP students in bilingual education. Additional indicators and research questions that guided the IDRA study included the following.
School Indicators
- What are the school indicators, including retention rate, dropout rate, enrollment rate in gifted and talented programs and in advanced placement programs, enrollment in special education or remedial programs, test exemption rates, and program exiting standards (by LEP and non-LEP percentages)?
Student Outcome Indicators
- What are the student outcomes for oral and written language proficiency (by LEP and non-LEP percentages)?
- What are the student outcomes for content area mastery in English and the native language (by LEP and non-LEP percentages)?
School Level Indicators
- How evident is leadership at the school level, and what are the characteristics?
- How evident are the vision and goals at the school level, and what are the characteristics?
- What are the characteristics of the school’s climate?
- What linkages exist between central office and school level staff? How are they characterized?
- How is the school organized?
- What are the demographic characteristics of professional staff, and what opportunities for professional development are provided?
- What is the type, level and quality of parent involvement in the school and the bilingual education program?
- How do staff hold themselves accountable for student success, and how are students assessed?
- How are the staff selected and recognized?
- What is the type, level and quality of community involvement in the school and the bilingual education program?
Classroom Level: Programmatic and Instructional Practices
- What are the characteristics of the bilingual education program model?
- What are the characteristics of the classroom climate?
- What are the teacher expectations regarding student success?
- How is the program articulated across grade levels?
IDRA ensured that programs selected for site visits reflected the diversity of US schools and included elementary and secondary schools, different language groups, LEP concentrations, and Title I targeted assistance and schoolwide programs as well as Title VII grantees (current and former).
In addition to the review of quantitative student and school outcome data, school demographic data, surveys of principals, teachers and administrators, and structured formal classroom observations were other sources of quantitative data. Qualitative data included structured interviews with the school principals and the administrators and focus group interviews with teachers, parents and students (whenever possible). Additional qualitative data were elicited from school profiles.
A framework was provided for describing each site visit thus providing a context and background for the visit. IDRA gathered, analyzed and synthesized all of these data. Results were then triangulated to provide a rich and accurate picture of each program. Patterns and trends across programs were also identified, providing the empirical basis for the resulting criteria.
It is important to note that this research study was not an evaluation of bilingual education programs, that is, we did not evaluate programs using a set of characteristics and criteria already established. Instead, we developed the criteria by observing and learning from programs that had evidence of achievement for all of its students. These criteria can now be used by practitioners and researchers to assess programs and recognize areas that are strong and others that may need improvement.
It is also important to note that if each of the programs in this study were to conduct a self-assessment by these criteria, there would be no perfect program – one that meets 100 percent of the criteria. They would, however, meet most of the criteria with room for improvement for a few. Perhaps one of the most important lessons these programs teach is the need for constant assessment in a context of school accountability for student success, and/or focus on improvement and celebration of achievements. It is in this spirit that we present the major findings of this study. Next month, we will feature the school indicators, including school profiles and organizing similarities.
US LEP Enrollment Growth from 1986-87 to 1996-97

Source: Donly, B., et al. Summary of Bilingual Education State Educational Agency Program Survey of States’ LEP Persons and Available Educational Services 1993-94. Prepared under contract for the US Department of Education by Development Associates Inc., in Arlington, Virginia (1995).
Percent of LEP Enrollment by State 1996-97

Source: Macías, R.F. et al. Summary Report of the Survey of the States’ Limited English Proficient Students and Available Educational Programs and Services, 1996-97 (Washington D.C.: National Clearinghouse for Bilingual Education, 1998).
Indicators of Success for Bilingual Programs
Bilingual Education Research Organizations
| Intercultural Development Research Association (IDRA) 5835 Callaghan Road, Suite 350 San Antonio, Texas 78228-1190 Ph: 210-444-1710; Fax: 210-444-1714 http://www.idra.org Contacts: Dr. María “Cuca” Robledo Montecel, Executive Director Sherry Carr Deer, Communications Specialist, feedback@idra.orgNational Association for Bilingual Education (NABE) 1220 L Street NW, Suite 605 Washington, D.C. 20005-4018 Ph: 202-898-1829; Fax: 202-789-2866 http://www.nabe.org Contacts: Delia Pompa, Executive Director, d_pompa@nabe.org Jaime Zapata, Public Relations, j_zapata@nabe.org National Clearinghouse for English Language Acquisition and Language Instruction Educational Programs (NCELA) Center for Education and Study of Diverse Populations Northeast and Islands Regional Educational Laboratory at Brown University |
Resources
Diaz-Rico, L.T. and J. Smith. “Recruiting and Retaining Bilingual Teachers: A Cooperative School Community-University Model,” Journal of Educational Issues of Language Minority Students (Winter 1994) v. 14 p. 255-268.
Haselkorn, D. “Breaking the Class Ceiling,” Education Week on the Web (August 7, 1996). Available at: http://www.edweek.org/ (archives).
María Robledo Montecel, Ph.D., is the IDRA executive director. Josie Danini Cortez, MA, is the production development coordinator. Comments and questions may be directed to them via e-mail at feedback@idra.org.
[©2001, IDRA. This article originally appeared in the IDRA Newsletter by the Intercultural Development Research Association. Permission to reproduce this article is granted provided the article is reprinted in its entirety and proper credit is given to IDRA and the author.]

