• by Roy L. Johnson, M.S. • IDRA Newsletter • October 2000 • 
The percent of students lost from public high school enrollment prior to graduation has remained relatively unchanged over the past six years at or about 40 percent.
Attrition data provide the number and rate of students who drop out of high school. Each year since 1995-96, two of every five students from a freshman class has left school prior to their graduation from a Texas public high school.
Research from the Intercultural Development Research Association (IDRA) shows that between 1985-86 and 1999-00 about 1.5 million secondary students have been lost from public school enrollment in Texas. The statewide attrition rate has ranged from a low of 31 percent in 1988-89 and 1989-90 to a high of 43 percent in 1996-97. On the average, nearly 115,000 students do not graduate each year, costing the state in excess of $319 billion (Robledo Montecel, 1999; Supik and Johnson, 1999).
The latest IDRA attrition study, completed in October 2000, reflects that two of every five students (40 percent) of the freshman (ninth grade) class of 1996-97 left school prior to high school graduation in 1999-00. An estimated 146,714 students were lost from enrollment due to attrition.
In 1986, IDRA conducted Texas’ first comprehensive statewide study of high school dropouts. Using a high school attrition formula, IDRA found that 86,276 students had not graduated from Texas high schools that year, costing the state $17 billion in forgone income, lost tax revenues, and increased job training, welfare, unemployment and criminal justice costs (Cárdenas, Robledo and Supik, 1986). IDRA’s latest study spans a 15-year time period from 1985-86 through 1999-00 and documents the number and percent of students who leave school prior to graduation. IDRA is the only organization to annually compute attrition rates and is the only state-level group that does so using consistent definitions and calculation methods (Robledo Montecel, 2000).
IDRA used high school enrollment data from the Fall Membership Survey of the Texas Education Agency (TEA) to compute countywide and statewide attrition rates by race-ethnicity and sex. The enrollment data from special school districts (military schools, state schools, and charter schools) were excluded from the analyses since they are likely to have unstable enrollments and/or lack a tax base to support school programs.
During the fall of each year, school districts are required to report information to TEA via the Public Education Information Management System (PEIMS) for all students and grade levels. IDRA’s attrition studies involve the analysis of ninth grade enrollment figures and 12th grade enrollment figures three years later. This period represents the time span during which a ninth grade student would be enrolled in high school prior to graduation.
Historical Attrition Data
Longitudinal statewide attrition rates are categorized by race and ethnicity. General conclusions follow.
The annual attrition rate has increased by 21 percent from 1985-86 to 1999-00.
Over the past 15 years, attrition rates have fluctuated between 31 percent and 43 percent. However, there has been an upward trend in attrition rates over the period, from 33 percent in 1985-86 to 40 percent in 1999-00. The percentage of students who have left school prior to graduation has increased by 21.2 percent from 1985-86 to 1999-00.
Numerically, 146,714 students were lost from public high school enrollment during the period of 1996-97 to 1999-00 as compared to 86,272 during the period of 1982-83 to 1985-86. From 1998-99 to 1999-00, the attrition rate declined by 4.7 percent, from 42 percent to 40 percent.
Hispanic students and Black students have had considerably higher attrition rates than White students.
Hispanic students are lost from enrollment at higher rates than either White students or Black students.
From 1985-86 to 1999-00, attrition rates for Hispanic students have increased 16 percent, from 45 percent to 52 percent. During this same period, the attrition rates for Black students have increased by 38 percent, from 34 percent to 47 percent. Attrition rates for White students have increased by 4 percent, from 27 percent in 1985-86 to 28 percent in 1999-00.
Over the 15-year period, Native American students and Asian/Pacific Islander students had a decline in their attrition rates. Native American students had a 4 percent decline in their attrition rates, from 45 percent to 43 percent, while Asian/Pacific Islander students had a decline of 39 percent, from 33 percent to 20 percent.
The longitudinal attrition rates for students who are Hispanic, Black or Native American have been typically higher than the overall attrition rates. Attrition rates for White students and Asian/Pacific Islander students have been typically lower than the overall attrition rates.
Hispanic students account for nearly half of the estimated 1.5 million students lost to attrition.
For the period of 1985-86 to 1999-00, students from ethnic minority groups accounted for two-thirds of the estimated 1.5 million students lost from public high school enrollment. Hispanic students account for nearly half (47.6 percent) of all students lost from enrollment across the longitudinal period. Black students have accounted for 17.3 percent of all students lost due to attrition over the years, and White students have accounted for 33.7 percent of students lost from high school enrollment over time.
The attrition rates for males have been higher than those of females.
Between 1985-86 and 1999-00, attrition rates for males have increased by 26 percent, from 35 percent to 44 percent. Attrition rates for females have increased by 13 percent, from 32 percent to 36 percent. Longitudinally, males have accounted for 56.1 percent of students lost from school enrollment, while females have accounted for 43.9 percent.
Latest Attrition Results
The latest attrition study by IDRA shows that in Texas 52 percent of Hispanic students and 47 percent of Black students were lost from public school enrollment (compared to 28 percent of White students) between 1996-97 and 1999-00.
This study confirms findings in earlier reports that Hispanic students and Black students are at greater risk of being lost from high school enrollment prior to graduation than White students. Data from this study also show that males are more likely to be lost from enrollment than females. The overall attrition rate is 40 percent. Major findings of the 1999-00 attrition study include the following.
Two of every five high school students were lost from high school enrollment prior to graduation.
Two of every five students enrolled in the ninth grade in Texas public schools during the 1996-97 school year failed to reach the 12th grade in 1999-00. An estimated 146,714 students, or about 40 percent of the 1996-97 freshman class, were lost from public school enrollment by 1999-00.
Hispanic students and Black students were more likely than White students to be lost from high school enrollment in 1999-00.
Fifty-two percent of Hispanic students and 47 percent of Black students were lost from public school enrollment, compared to 28 percent of White students. Hispanic students were 1.9 times more likely than White students to leave school before graduation, while Black students were 1.7 times more likely than White students to leave school before completion.
From 1998-99 to 1999-00, three racial-ethnic groups had a decline in attrition rates. White students had a decline from 31 percent to 28 percent, Black students had a decline from 48 percent to 47 percent, and Hispanic students had a decline from 53 percent to 52 percent. Asian/Pacific Islander students had an increase from 19 percent to 20 percent.
Native American students had an increase from 25 percent to 43 percent, following a significant decline from 42 percent to 25 percent the previous school year. The fluctuation in Native American attrition rates over the past two years can be attributed to its small population size.
More than half of the students lost from enrollment were Hispanic.
Hispanic students made up the highest percentage of students lost from public high school enrollment in 1999-00. Over half (51.2 percent) of the students lost from school enrollment were Hispanic. White students comprised 30.2 percent of the students lost from enrollment, and Black students comprised 17.1 percent.
Males were more likely to be lost from enrollment than females.
Between 1996-97 and 1999-00, 44 percent of males were lost from public high school enrollment, compared to 36 percent of females.
Overall, there has been a 21 percent increase in the attrition rate since 1985-86.
The percent of students lost from public high school enrollment has increased by 21.2 percent between the 1985-86 school year (33 percent) and the 1999-00 school year (40 percent). The number of students lost through attrition per school year has increased from about 86,000 in 1985-86 to about 147,000 in 1999-00.
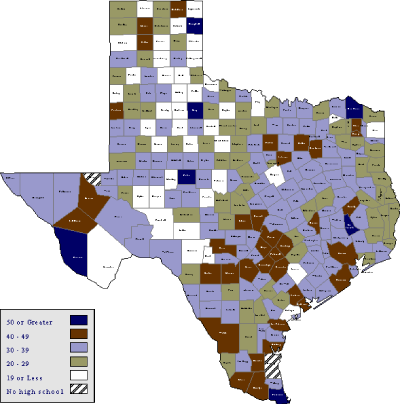
Enrollment and attrition data for the 1996-97 and 1999-00 school years are categorized by race and ethnicity. Statewide and county attrition rates are presented for the three major race and ethnicity groups in the state. The map below displays the distribution of 1999-00 attrition rates by county in Texas. Seven counties had overall attrition rates of 50 percent or greater.
Texas Education Agency Reported Dropout Rates
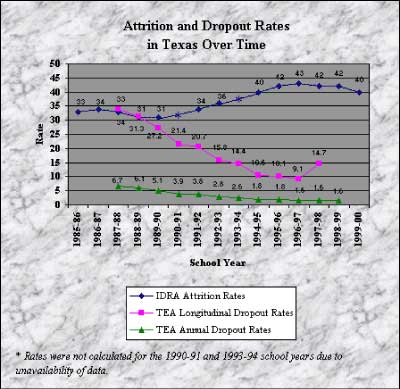
Published reports by IDRA and TEA reach markedly difference conclusions about the number and percent of students who do not graduate from Texas public high schools. IDRA attrition analyses show that the number and percent of students lost has increased since the mid-1980s. Conversely, TEA estimates indicate that dropout rates have declined steadily during this same period.
IDRA executive director, Dr. María Robledo Montecel summarizes: “In the mid 1980s, IDRA and official TEA estimates of the number and percentage of dropouts were very similar… As the agency’s dropout estimates have declined over the last decade, so has the credibility of its dropout reporting” (2000).
For the 1997-98 school year, TEA reported a 1.6 percent annual (event) dropout rate, a 14.7 percent actual longitudinal rate (grades 7-12) and a 36 percent attrition rate (grades 9-12). For the 1997-98 school year, IDRA showed a 42 percent attrition rate. (See the graph below for a comparison of attrition and state dropout data.)
National and State Dropout Rates
In 1998, the National Center for Education Statistics (NCES) reported an annual (event) dropout rate of 4.8 percent, a status dropout rate of 11.8 percent, and a high school completion rate of 84.8 percent for the United States (based on the states that submitted state-level data). NCES used data from the Current Population Survey (CPS) of the U.S. Census Bureau to compute national high school dropout and completion rates by various background characteristics as sex, race-ethnicity, family income, and region of the country (NCES, 1999).
In its 1998 report, NCES concluded that dropout rates have fluctuated over the past quarter of the century with an overall downward trend (see box below). NCES further concluded that Hispanic students and Black students are at greater risk of dropping out than are White students and that the percentage of students who dropped out of school each year is relatively unchanged. According to the report, high school completion rates have shown limited gains in the last quarter of a century.
NCES is working with state education agencies and school districts across the country, through the National Cooperative for Elementary and Secondary Statistics and the Common Core Data collection, to develop a national database of public school dropout rates. The number of participating states using consistent data definitions and collection procedures has increased from 14 in 1991-92 to 26 in 1996-97. In 1996-97, 38 states including the District of Columbia presented event dropout data.
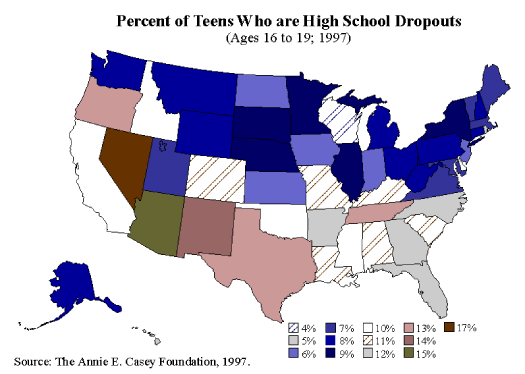
In 1996-97, Texas had a national comparison annual dropout rate of 3.6 percent. This rate was higher than the 1.6 percent reported by TEA in its annual state report for that year, primarily due to dropout definitions and calculation methodologies. A state comparison of the percent of teens who are high school dropouts is presented in the map below.
Conclusions
Several conclusions may be drawn from IDRA’s latest attrition study.
- High school dropouts continues to be a major problem in Texas and the United States as a whole. A significant number and percent of students are lost from high school enrollment prior to graduation.
- The estimated net loss in revenues and related costs to the state of Texas continues to escalate. In 1986, IDRA estimated that the issue of school dropouts was costing the state $17.12 billion in foregone income, lost tax revenues, and increased job training, welfare, unemployment and criminal justice costs. By 1998, 12 years later, the estimated costs were $319 billion.
- The annual attrition rate in Texas public high schools has increased by 21 percent from 1985-86 to 1999-00. Longitudinally, overall attrition rates have ranged from 31 percent to 43 percent.
- Hispanic students and Black students have had considerably higher attrition rates than White students. In 1999-00, Hispanic students had an attrition rate of 52 percent compared to 47 percent for Black students and 28 percent for White students.
- The credibility of official TEA estimates of the number and percentage of dropouts are in question. IDRA and NCES data show that dropout rates in the state of Texas are higher than those reported by the state education agency.
- The existing state dropout reporting system needs to be restructured. The state definition for dropouts needs to be amended and simplified. The state goal should be that all students remain in school and graduate with a high school diploma. Each school district should establish an oversight committee or taskforce to systematically monitor dropout counting and reporting efforts.
- The goal of reducing the dropout rate should be to increase the number and percentage of students graduating with a high school diploma.
While IDRA will continue to compile attrition data for the state, it is critical that the people of Texas, including its policymakers, make this issue a priority. Far too many Texas students are leaving our schools without ever earning their high school diplomas. One student lost is too many.


National Dropout Completion Rates in the US by Race-Ethnicity, October 1998 |
|||||
Measure |
Total |
White, non-Hispanic |
Black, non-Hispanic |
Hispanic |
Asian/Pacific Islander
|
| Event (Annual) Dropout Rate (percentage of youth ages 15 to 24 who dropped out of grades 10 to 12, October 1997 to October 1998) | 4.8 | 3.9 | 5.2 | 9.4 | – |
| Status Dropout Rate (percentage of youth ages 16 to 24 who were dropouts in 1998) | 11.8 | 7.7 | 13.8 | 29.5 | 4.1 |
| Completion Rate (percentage of youth age 18 to 24 who were high school completers in 1998) | 84.8 | 90.2 | 81.4 | 62.8 | 94.2 |
|
Source: US Department of Commerce, Bureau of the Census, Current Population Survey, October 1998. |
|||||
Resources
Cárdenas, J., M. Robledo and J. Supik. Texas School Dropout Survey Project: A Summary of Findings (San Antonio, Texas: Intercultural Development Research Association, 1986).
National Center for Education Statistics. Dropout Rates in the United States, 1998 (Washington, D.C.: US Department of Education, Office of Educational Research and Improvement, November 1999).
Robledo Montecel, M. Texas School Dropout Counting and Reporting – A Need for Credibility, written testimony to the Texas State Board of Education (San Antonio, Texas: Intercultural Development Research Association, September 2000).
Robledo Montecel, M. $319 Billion and 1.2 Million Students Lost, remarks to the Texas State Board of Education, Committee on Planning (San Antonio, Texas: Intercultural Development Research Association, 1999).
Supik, J. and R. Johnson. Missing: Texas Youth: Dropout and Attrition Rates in Texas Public High Schools (San Antonio, Texas: Intercultural Development Research Association, 1999).
Roy L. Johnson, MS, is the director of the IDRA Division of Evaluation Research. Comments and questions may be directed to him via e-mail at feedback@idra.org.
[©2000, IDRA. This article originally appeared in the October 2000 IDRA Newsletter by the Intercultural Development Research Association. Permission to reproduce this article is granted provided the article is reprinted in its entirety and proper credit is given to IDRA and the author.]


