• by Roy L. Johnson, M.S. • IDRA Newsletter • October 2003
 Thirty-eight percent of the freshman class of 1999-00 left school prior to graduating from a Texas public school in the 2002-03 school year. The latest attrition study of the Intercultural Development Research Association (IDRA) found that 143,280 out of 378,431 students from the class of 2003 were lost from public school enrollment between the 1999-00 school year and the 2002-03 school year.
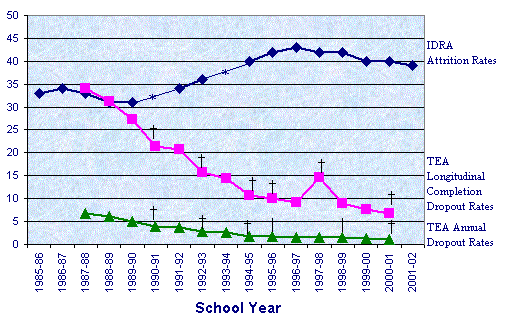
Spanning an 18-year period from 1985-86 through 2002-03, the IDRA attrition studies provide time series data on the number and percent of public school students who leave school prior to graduation.
Despite a one percentage point decline over each of the last two years, the overall attrition rate has remained relatively unchanged, suggesting that school holding power in Texas is less than satisfactory.
Weak School Holding Power is Costly
In 1986, IDRA conducted Texas’ first comprehensive statewide study of high school dropouts using a high school attrition formula to estimate the number and percent of students who leave school prior to graduation. IDRA’s inaugural study found that 86,276 students had not graduated from Texas public high schools, costing the state $17 billion in forgone income, lost tax revenues, and increased job training, welfare, unemployment and criminal justice costs (Cárdenas, Robledo and Supik, 1986).
Between the 1985-86 and 2002-03 school years, nearly 2 million students have been lost from public school enrollment costing the state of Texas nearly $500 billion in forgone income, lost tax revenues, and increased job training, welfare, unemployment and criminal justice costs. The study in 1986 was the state’s first major effort to assess the school holding power of Texas public schools.
What is Attrition?
Attrition rates serve as an indicator or measure of a school’s holding power or ability to keep students enrolled in school and learning until they graduate. Attrition – in its simplest form – is the rate of shrinkage in size or number. Therefore, an attrition rate is the percent change in grade level enrollment between a base year and an end year.
During the fall of each year, school districts are required to report information to the Texas Education Agency (TEA) via the Public Education Information Management System (PEIMS) for all students and grade levels. IDRA’s attrition studies involve the analysis of ninth grade enrollment figures and 12th grade enrollment figures three years later. This period represents the time span during which a ninth-grade student would be enrolled in high school.
IDRA collects and uses high school enrollment data from the Fall Membership Survey of TEA to compute countywide and statewide attrition rates by race-ethnicity and sex. Enrollment data from special school districts (military schools, state schools, and charter schools) are excluded from the analyses since they are likely to have unstable enrollments or lack a tax base for school programs.
Latest Study Results
Historical statewide attrition rates and numbers of students lost to attrition are categorized by race and ethnicity and by gender (See box below). General conclusions follow.
The overall attrition rate has increased by 15 percent from 1985-86 to 2002-03. The percentage of students who left high school prior to graduation was 33 percent in 1985-86 compared to 38 percent in 2002-03. Over the past 18 years, attrition rates have fluctuated between a low of 31 percent in 1988-89 and 1989-90 to a high of 43 percent in 1996-97. Numerically, 143,280 students were lost from public high school enrollment in 2002-03 as compared to 86,272 in 1985-86.
The overall attrition rate was less than 40 percent in 2002-03 for the second time in nine years. Between 1994-95 and 2000-01, the overall attrition rate ranged from a low of 40 percent to a high of 43 percent. In 2002-03, the overall attrition rate was 38 percent representing the lowest rate since 1992-93.
The gaps between attrition rates of Hispanic students and Black students and those of White students have widened since 1985-86. Hispanic students and Black students have had considerably higher attrition rates than White students. From 1985-86 to 2002-03, attrition rates of Hispanic students increased by 11 percent (from 45 percent to 50 percent). During this same period, the attrition rates of Black students increased by 32 percent (from 34 percent to 45 percent). Attrition rates of White students declined by 4 percent (from 27 percent to 24 percent). Hispanic students have higher attrition rates than either White students or Black students.
From 1985-86 to 2002-03, Native American students, Asian/Pacific Islander students, and White students had a decline in their attrition rates. Native American students had a decline of 13 percent in their attrition rates (from 45 percent to 39 percent) and Asian/Pacific Islander students had a decline of 48 percent (from 33 percent to 17 percent).
The historical attrition rates for Hispanic students and Black students have been typically higher than the overall attrition rates. For the period of 1985-86 to 2002-03, students from ethnic minority groups account for about two-thirds of the estimated 1.9 million students lost from public high school enrollment. Hispanic students account for nearly half (49.0 percent) of the students lost to attrition. Black students account for 17.3 percent of all students lost from enrollment due to attrition over the years, and White students account for 32.3 percent of students lost from high school enrollment over time. Attrition rates for White students and Asian/Pacific Islander students have been typically lower than the overall attrition rates.
The attrition rates for males have been higher than those of females. Between 1985-86 and 2002-03, attrition rates for males have increased by 17 percent (from 35 percent to 41 percent). Attrition rates for females have increased by 6 percent (from 32 percent to 34 percent). Longitudinally, males have accounted for 56.4 percent of students lost from school enrollment, while females have accounted for 43.6 percent.

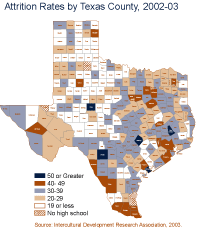
 See the graphic above and the tables entitled: “Longitudinal Attrition Rates in Texas Public High Schools, 1985-86 to 2002-03,” and “1990-00 and 2002-03 Enrollment and 2002-03 Attrition in Texas” for attrition data over time. See tables and the map at right for rates by county.
Conclusions
Over the past few decades, IDRA research shows that an estimated 1.9 million Texas high school students left school prior to graduation. Though the overall attrition rate has declined by 1 percentage point in each of the last two years, attrition rates have remained relatively stable at or near 40 percent.
IDRA attrition analyses show that since the mid-1980s the number and percent of students lost from public school enrollment has increased for the state of Texas. TEA paints another picture. In August 2003, TEA reported for the 2001-02 school year an annual dropout rate of 0.9 percent for grades seven through 12 and 1.3 percent for grades nine through 12. For the class of 2002, TEA reported a longitudinal completion rate of 5.6 percent for grades seven through 12 and 5.0 percent for grades nine through 12.
In order to reduce the number and percent of students who leave school prior to graduation, local, state and national attention must be directed at: (1) standardizing dropout definitions and calculation methodologies; (2) collecting accurate and reliable dropout, completion and graduation data; (3) identifying and evaluating effective dropout prevention programs and strategies; (4) selecting and implementing appropriate performance indicators for assessing school holding power; and (5) reporting dropout, completion and graduation data. The challenge of increasing school holding power must become a mandate in our state and our nation.
| Number of Students Lost to Attrition to Texas School Years 1985-86 to 2002-03 | ||||||||
|
School Year
|
Total
|
Race-Ethnicity
|
Gender
|
|||||
|
Native American
|
Asian/ |
Black
|
White
|
Hispanic
|
Male
|
Female
|
||
| 1985-86 1986-87 1987-88 1988-89 1989-90 1990-91 1991-92 1992-93 1993-94 1994-95 1995-96 1996-97 1997-98 1998-99 1999-00 2000-01 2001-02 2002-03 |
86,276
90,317 92,213 88,538 86,160 – 91,424 101,358 – 123,200 135,438 147,313 150,965 151,779 146,714 144,241 143,175 143,280 |
185
152 159 252 196 – 215 248 – 296 350 327 352 299 406 413 237 436 |
1,523
1,406 1,447 1,189 1,214 – 1,196 1,307 – 1,226 1,303 1,486 1,730 1,680 1,771 1,794 1,244 1,611 |
12,268
14,416 15,273 15,474 15,423 – 15,016 17,032 – 22,856 25,078 27,004 26,938 25,526 25,097 24,515 25,017 25,066 |
38,717
38,848 34,889 28,309 24,510 – 27,055 32,611 – 41,648 45,302 48,586 49,135 48,178 44,275 41,734 39,953 36,948 |
33,583
35,495 40,435 43,314 44,817 – 47,942 50,160 – 57,174 63,405 69,910 72,810 76,096 75,165 75,785 76,724 79,219 |
46,603
48,912 50,595 49,049 48,665 – 51,937 57,332 – 68,725 75,854 82,442 85,585 86,438 83,976 82,845 82,762 82,621 |
39,673
41,405 41,618 39,489 37,495 – 39,487 44,026 – 54,475 59,584 64,871 65,380 65,341 62,738 61,396 60,413 60,659 |
| All Years |
1,922,391
|
4,523
|
23,127
|
331,999
|
620,698
|
942,034
|
1,084,341
|
830,050
|
| Figures calculated by IDRA from the Texas Education Agency Fall Membership Survey data. Rates were not calculated for the 1990-91 and 1993-94 school years due to the unavailability of data. Source: Intercultural Development Research Association, 2003. |
||||||||
Resources
Cárdenas, J.A., and M. Robledo, J. Supik. Texas School Dropout Survey Project: A Summary of Findings (San Antonio, Texas: Intercultural Development Research Association, 1986).
Johnson, R.L. “Texas Schools Have Weak Holding Power,” IDRA Newsletter (San Antonio, Texas: Intercultural Development Research Association, October 2002).
Johnson, R.L. “School Holding Power Goal Unachieved in Texas,” IDRA Newsletter (San Antonio, Texas: Intercultural Development Research Association, October 2002).
Robledo Montecel, M. “Texas Needs Diplomas, Not Delusions,” IDRA Newsletter (San Antonio, Texas: Intercultural Development Research Association, June-July 2002).
Texas Education Agency. Secondary School Completion and Dropouts in Texas Public Schools: 2001-02 (Austin, Texas: Texas Education Agency, August 2003).
U.S. Department of Education, Office of Educational Research and Improvement, National Center for Education Statistics. Documentation to the NCES Common Core of Data, Local Education Agency Universe Dropout File: School Year 1999-00.
Roy Johnson, M.S., is the director of the IDRA Division of Evaluation Research. Comments and questions may be directed to him via e-mail at feedback@idra.org.
[©2003, IDRA. This article originally appeared in the October 2003 IDRA Newsletter by the Intercultural Development Research Association. Permission to reproduce this article is granted provided the article is reprinted in its entirety and proper credit is given to IDRA and the author.]


