Infographics
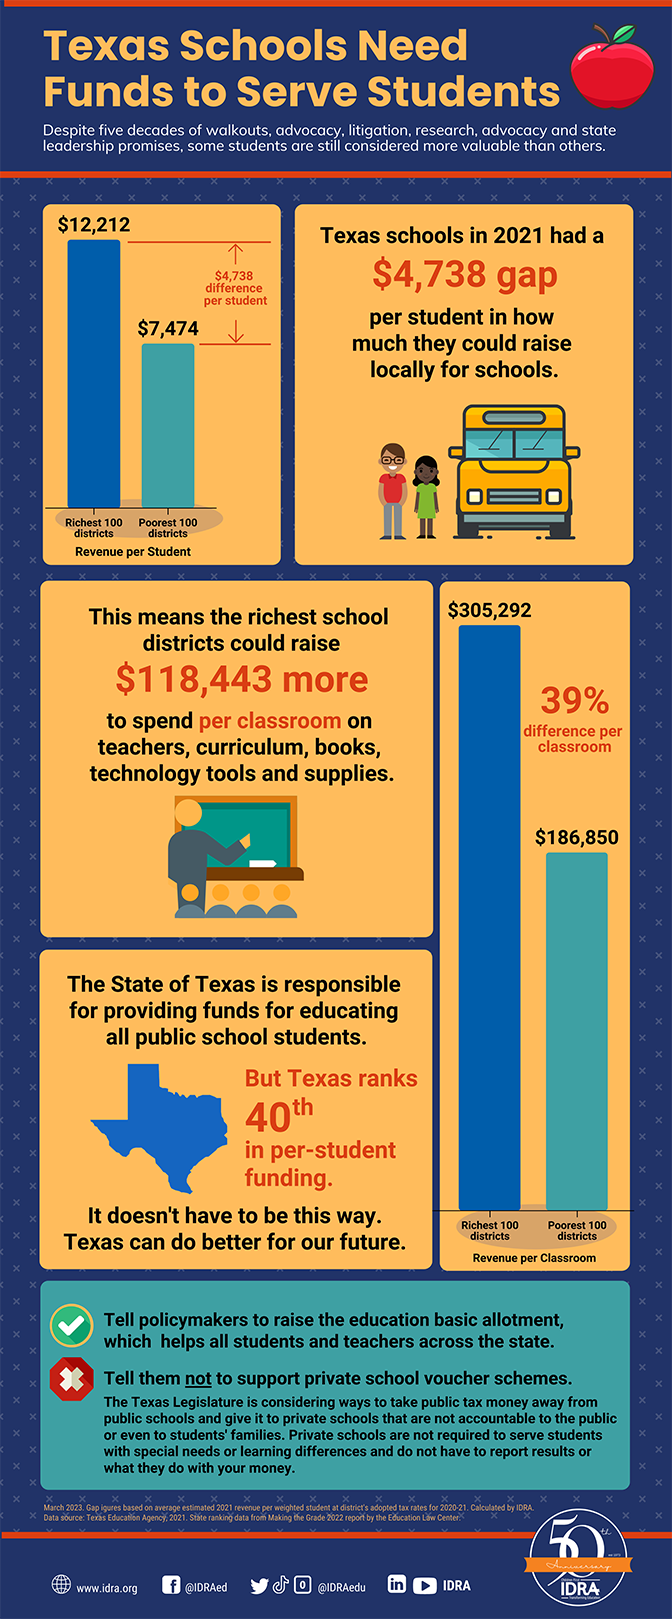
Texas Schools Need Funds to Serve Students – Infographic
Despite five decades of walkouts, advocacy, litigation, research, advocacy and state leadership promises, some Texas students are still considered more … read more
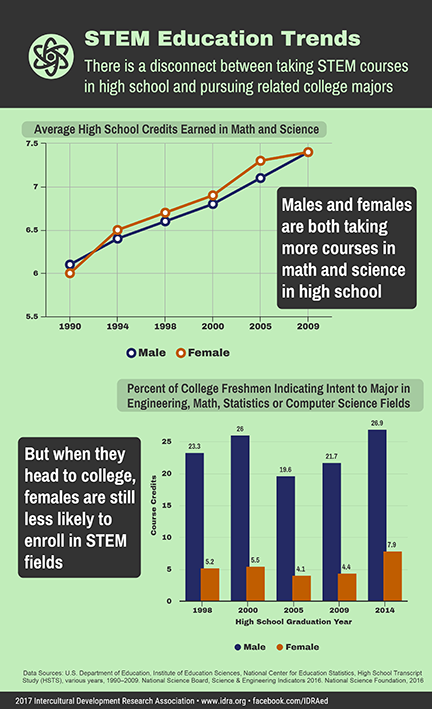
STEM Education Trends – Infographic
There is a disconnect between taking STEM courses in high school and pursuing related college majors. Males and females are both … read more
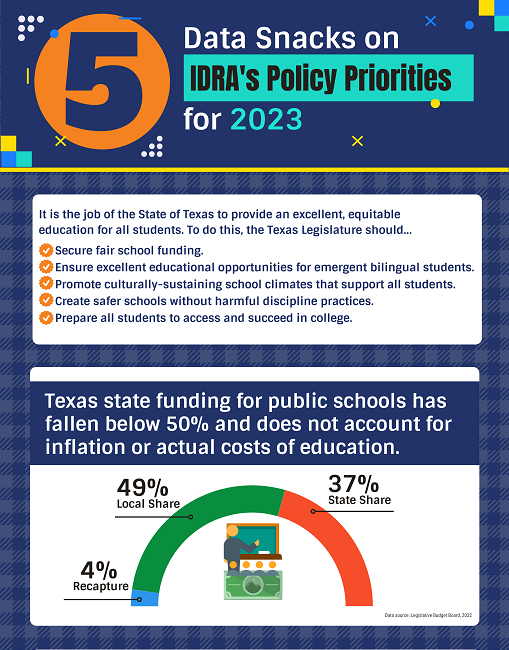
5 Data Snacks on IDRA’s Policy Priorities for 2023 – Infographic
It is the job of the State of Texas to provide an excellent, equitable education for all students. To do … read more
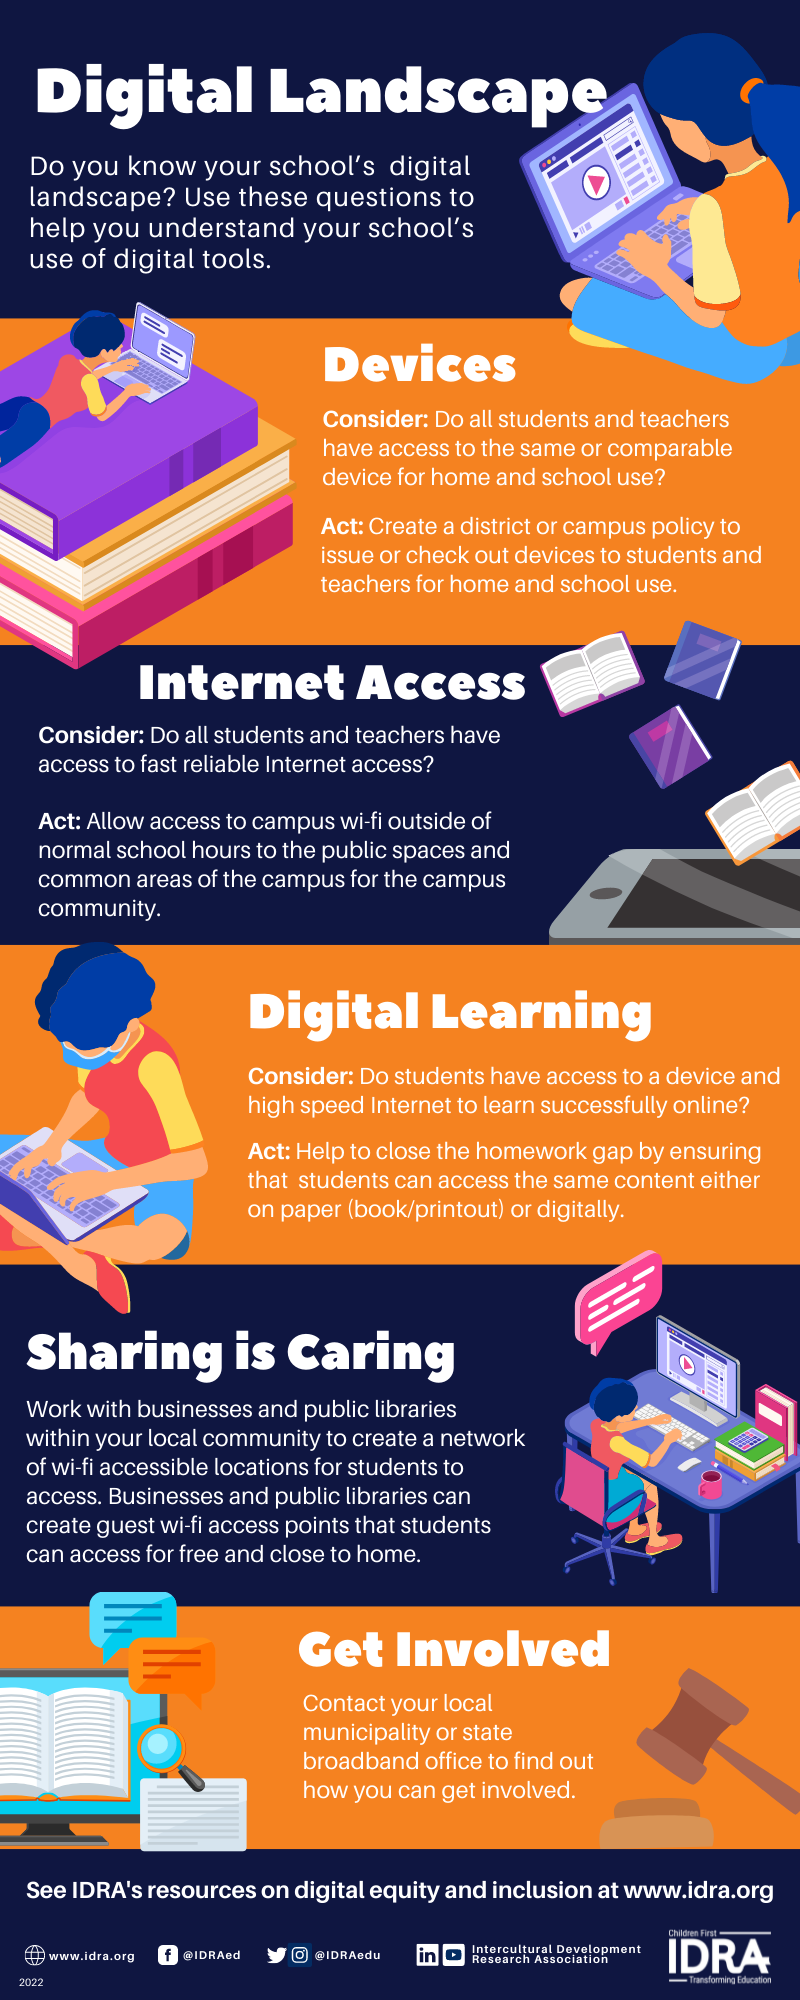
Digital Landscape – Infographic
Digital equity is critical to student success in school and beyond. Schools can support students and their families in accessing … read more
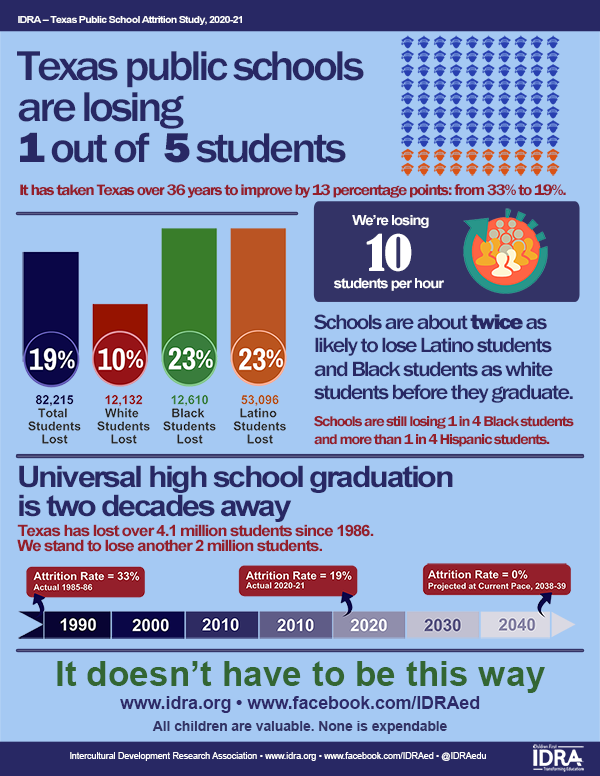
Texas Public School Attrition 2020-21 – Infographic
Texas public schools are losing one out of five students. Each fall, IDRA releases its attrition study. Attrition rates are … read more
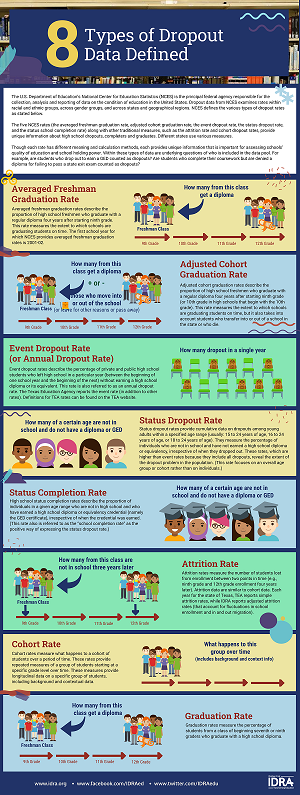
8 Types of Dropout Data Defined – Infographic
When IDRA was commissioned to investigate dropout rates in Texas in the mid-1980s, the state had no data at all … read more
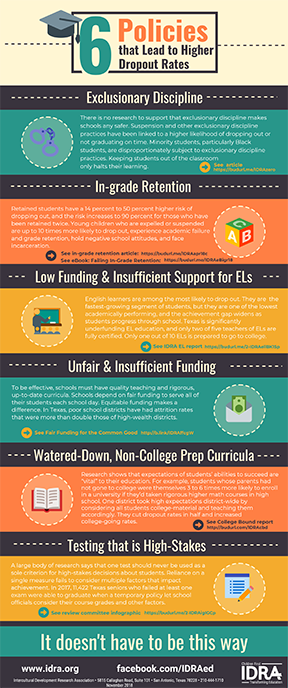
6 Policies and Practices that Lead to Higher Dropout Rates – Infographic
IDRA identified six school policies that lead to higher dropout rates as outlined this infographic: Exclusionary Discipline In-grade Retention Low … read more
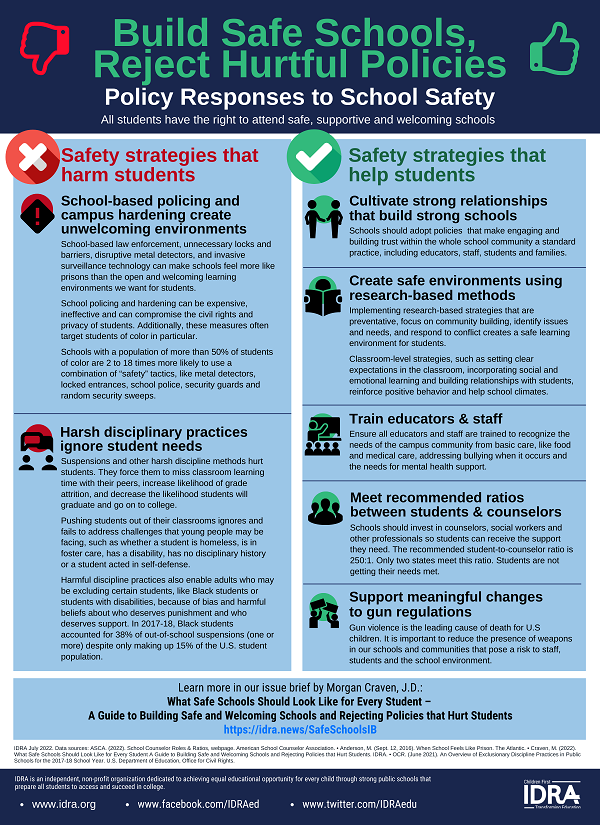
Build Safe Schools, Reject Hurtful Policies – Infographic
All students have the right to attend safe, supportive and welcoming schools. See IDRA’s infographic below showing good and bad … read more
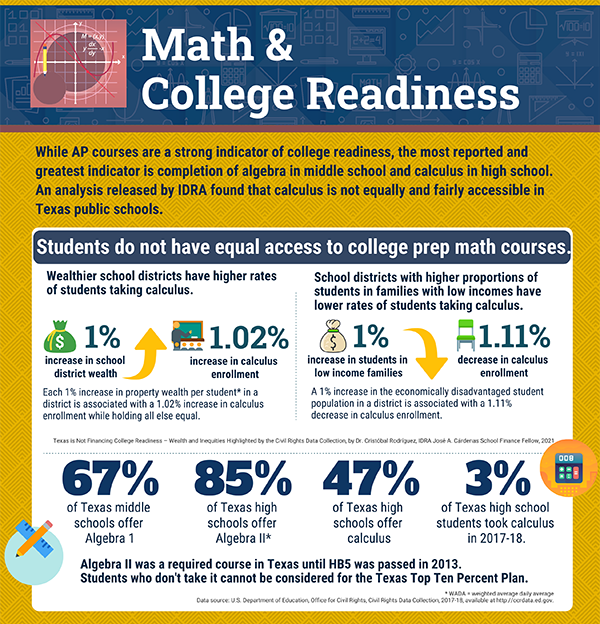
Math & College Readiness – Infographic
While AP courses are a strong indicator of college readiness, the most reported and greatest indicator is completion of algebra … read more
